
About these pages
A tie-break rule is not asking to be judged: it is asking to be measured. It exists to answer one precise question, which of the two archers is the better, and of an instrument like that you can ask things you cannot ask of an opinion. Not whether it is fair, but how often it gets the answer wrong, and above all whether the room for doing better is wide enough to justify the argument spent on it.
Matteo Campagna · matteocampagna.com
Abstract
The day that is decided in 40 seconds
PART ONE — THE TIE
1. What happens when a match ends five-all
2. What a tie-break rule has to decide
3. A refresher: the group and its spread
4. From score to spread, and back
5. How to compute a match that was never shot
6. The paradox of the tie
7. Why the arrow loses nothing, and why that is not enough
8. How much there is to gain, at most
9. The four ceilings
10. Fourteen ways to decide, one by one
11. The weights the rings would deserve
12. Measuring distances: the road nobody has tried
13. The cascade, and why it looked like the answer
14. The reversal: when counting tens points to the wrong archer
15. The explanation, which is arithmetic and not statistical
16. Where the reversal holds, and where it stops holding
17. The proposal, and why it works
18. How the article would be drafted
19. How much spectacle you want to buy
20. If archers were not as we have described them
21. An insurance policy, not a rule
22. The five rules left standing
23. The bracket matters more than the rule — but by how much
24. What to take away from Part One
PART TWO — THE COMPETITION
25. The competition is a single object
26. How wrong the qualification round gets it
27. The toll of seeding
28. Seven ways to build a bracket
29. Double elimination: right in theory
30. Repechage has a dose
31. Where to take the seeding from
32. Five ways to shoot 15 arrows
33. What spectacle means, in a form that can be counted
34. The rule no format can break
35. How the pieces combine
36. The precision design
37. The spectacle design
38. The balanced design
39. The minimal design: improving without changing anything visible
40. The four compared
41. What to take away from Part Two
PART THREE — ARCHER OF THE YEAR
42. The opposite problem
43. What “best of the year” means
44. How much a season can tell apart
45. Why one score cannot be compared with another
46. The procedure, step by step
47. One example worked through in full
48. The problem no amount of data solves
49. Who enters the ranking, and when the award is individual
50. What really matters in a calendar
51. How much data is needed
52. The final comparison: what a season is worth
53. What to take away from Part Three
APPENDIX B — WHEN FORM MATTERS
CLOSING
54. The thread running through the three parts
55. What the model does not see
56. What changes in each conclusion
57. The limits
58. How a result expired without becoming false
59. What I predicted, and what proved me wrong
60. What I would say to those who have to decide
NOTE ON DATA, SOURCES AND METHOD
APPENDIX — TWENTY-ONE THINGS LEARNED BY GETTING THEM WRONG
Principles
Notes on technique
And, above all of them, the limit none of them sees
MATHEMATICAL APPENDIX
The model
The optimal rule on coordinates
The ring weights
The set-play tie
The reversal of the ten count
The ranking
Conventions
Ties, competitions and seasons in archery
Abstract
In Olympic recurve archery a set-system match can end five-all, and at that point the rules call for a single arrow to settle it. This volume measures how well that arrow — and every other admissible tie-break rule — identifies the better archer, and then widens the question to the tournament and to the season. The model is an archer who shoots a Gaussian group of known spread; from there matches are computed by exact convolution, tournaments by paired simulation, and the season ranking by a joint estimation of abilities and difficulties. The main results: the rule currently in force sits in the bottom third of the alternatives examined, and nine of the fourteen considered beat it on the reference pair; reading the match total before the arrow is worth 0.3 points, less than recording distances is worth, and it retains that advantage even when the shoot-off is shot worse than the rest of the match; seeding matters more than bracket structure, and using the season ranking as the seeding is the most effective intervention among those that require nobody to shoot an extra arrow; and the questions the debate concentrates on — the length of the sets, the width of the repechage — move the results by fractions of a match out of sixty-three.
The day that is decided in 40 seconds
The last arrow of the fifth set is in the target, the judges have finished scoring, and the number neither archer wanted to see comes up on the board: five-all. There is no sixth set to shoot, because the rules provide for five and five have been shot. What happens next happens at no other moment of the competition: the two archers walk back to the shooting line with a single arrow in the quiver, and that arrow decides the match.
It takes 40 seconds. Inside those 40 seconds go the round, the medal, and sometimes four years of work.
Anyone who spends time in this sport has heard the two objections that follow, and they are always the same two. On one side are those who hold that 40 seconds cannot wipe out two hours of competition, and that entrusting a decision of that weight to a single shot is a draw with a few extra steps. On the other are those who answer that shooting well under exactly that pressure is the job, and that the strongest archer proves it precisely there, where everything counts for more.
Both are serious arguments, and they have faced each other ever since the set system was introduced. What I have not found, on either side, is a number.
And yet a tie-break rule is not asking to be judged: it is asking to be measured. It exists to answer a precise question — which of the two archers is the better one — and of an instrument like that you can ask questions you cannot ask of an opinion. Not whether it is fair, but how often it gets it wrong. And above all the question the debate lacks entirely: whether the margin for doing better is large enough to be worth the discussion devoted to it.
Why the book does not stop at the tie
This volume begins there, and then widens of its own accord. Once you have measured what the tie rule is worth, it becomes natural to ask what everything else is worth: the match format, the structure of the bracket, the qualification round that decides who meets whom. And once that calculation is done, the third question follows just as naturally — the one usually asked first, and which should be asked last: who, at the end of the year, is the most accurate archer, and by what right do we say so.
They are three questions that look different and are the same question at three scales. An instant, a day, a season. In all three the task is to establish how much information is really there in the data we have, and how much of it is thrown away by the way we read it.
The answers, straight away
There is no reason to keep the reader waiting, so here at the outset is what the following pages demonstrate.
The tie-break rule currently in force is beaten by 9 of the 14 alternatives I measured, and the best among those that could be adopted tomorrow fits in a single line of the rulebook: the archer with the higher total score in the match wins, and only if the totals are also level is an arrow shot. The criterion tradition considers most natural, counting tens, points to the wrong archer more often than to the right one every time it is consulted after a tie — and that is the only way it is ever consulted. Not because of a defect in the rule, but for an arithmetic reason that can be demonstrated in two tables and that, once seen, is obvious.
All this, however, matters little, and that is the second thing these pages measure. In a 64-archer competition 63 matches are shot: moving from the rule in force to the best one possible changes the winner of fewer than one match, and changing the format in which the 15 arrows are shot changes it by a third of a match. Put in a form you can picture: you have to watch three whole competitions before that change of format moves a single archer from one side of the bracket to the other.
What really matters is where the seeding used to build the bracket comes from. Today the title goes to the best archer in the field 9.7 times in a hundred, that is one competition in ten. Using the season ranking instead of the score of the day, and re-drawing the pairings at every round, takes this to 13.7 times in a hundred: one competition in seven. Over a hundred tournaments that is four more titles awarded to the right person, and it costs nobody an arrow, a minute or a shoot-off.
Anyone unwilling to change even that still has a route, and it is the fourth of the competition designs these pages describe: 1.1 points can be gained — one more title every ninety competitions — without touching anything that is visible (same qualification, same bracket, same duration), changing only how the results the competition already produces are read. One more title every ninety competitions, without a single person in the stands noticing a thing. There are two interventions, and both require recording where inside the ring each arrow landed: ordering the qualification by distance from the centre, which on its own is worth 0.5, and settling ties on the same measurement, which on its own is worth 0.7. Together they give 1.1, less than their sum, because in part they buy the same thing.
Anyone who does not want to acquire instrumentation has a cheaper alternative that applies to the tie alone, worth 0.33 points on the title and costing one line of the rulebook: reading the match total before the shoot-off arrow. It is an alternative precisely because the two tie rules cannot both apply to the same match.
And not even all this is enough, which is the finding that reorders the discussion. In a single-elimination tournament the title goes to the best archer in the field 9.7 times in a hundred today, 14.2 if everything that can be proposed with existing equipment is adopted, 14.6 if distances were measured. So even doing everything the best possible way, in six competitions out of seven the title goes to someone who is not the best archer in the field. A season of competitions, read properly, identifies the best archer three times out of four: the difference between those two figures is the real result of this book. The tournament is not making a mistake: it is being asked to do two things at once, and it fully succeeds at neither, because they are in conflict.
How the numbers that follow should be read
The model leaves out three real things: the pressure of the moment, the wind, and the weight of what is at stake. I have measured them separately, and chapter 55 does that calculation for all three parts together, which is the right place for it because there is only one model. The question I put to each is not whether it moves the numbers — it certainly does — but in which direction it moves each conclusion.
The answer is that they almost always make the conclusions worse rather than weaker. If I find here that a rule discriminates poorly, on the field it will discriminate even less; if I find that the title goes to the best archer one competition in ten, on a windy day it goes there less often; if I find that the qualification seeding is off by eight places, in the wind it is off by more. The numbers in these pages are therefore a benchmark under the stated assumptions, and for the perturbations I have modelled (heavy tails, off-centre group, elliptical group, within-match drift, wind, pressure) the measurements shrink. It does not follow that the real field must lie below: a simulation does not observe the real field, and qualities correlated with ability could push the other way. Outside that list I do not demonstrate it, and where the direction is not established I say so.
I found two exceptions, and I declare them here because they are the occasions on which an excluded factor works against one of my conclusions. The first: wind attenuates the reversal of the ten count discussed in chapter 14 — it does not cancel it (it stays below the coin toss even in a strong wind) but it makes it less marked, and in chapter 22 I report by how much. The second: wind also reduces how often matches end five-all, and therefore how often the tie rule is called upon at all, which attenuates the effect of any intervention on that rule without cancelling it.
How this essay is organised
Three parts, each ending with a chapter that sums up what to take away: anyone wanting the conclusions without the derivations can read those three and the closing. Part One also builds the tools the other two need, so its first five chapters apply to the whole volume. The closing contains, besides the recommendations, the reckoning of the factors the model ignores and the list of what this work cannot say.
1. What happens when a match ends five-all
I shall start at the beginning and describe in full how that five-all comes about. Those who do not spend time on shooting fields know the scene at second hand, and those who do take it so completely for granted that they no longer look at it — which is usually the condition under which mistakes are made.
In individual recurve the contest is the best of five sets, and each set is three arrows per archer. The points of the three arrows are added up, and whoever has shot more takes two set points; if the totals are equal, one each; whoever has shot less, nothing. The match is won by the first archer to reach 6 set points. The sum of all the arrows does not count: the sets count. An archer can shoot fifteen points more than the opponent across the whole match and lose it all the same, if those fifteen points were all taken in a single set, won by a wide margin, while the other four were lost narrowly.
The format exists for a specific reason. The previous system added up all the arrows and gave the win to the higher total, and it produced matches in which one archer pulled away by the third end and the rest was a formality: no tension, no comeback possible, and a crowd that left before the finish. With sets, every three arrows start again from zero, and a set lost by ten points costs exactly as much as a set lost by one. The comeback stays open until the last arrow.
The price of that choice is arithmetic and cannot be got around. Five sets distribute ten points, two per set; if after five sets neither archer has reached six, the only possible split is five-all. And at that point there is no way to continue, because the sets provided for are five and five have been shot.
What the rulebook says
At that point the rulebook calls for one arrow each: the higher score wins, and if the scores are equal the arrow closer to the centre decides. If the judges cannot tell them apart, the archers return to the line and repeat. In the concentric model I use here the two readings coincide for arrows that score, because a higher score corresponds to a shorter distance, and they remain distinct only when one of the two falls outside the scoring area.
A draw is not provided for at any stage. I verified both points at source, in the public version of the international federation’s rulebook, and I say so because in an earlier piece of work I reconstructed a similar clause from memory and got it wrong.
In international finals shooting is alternating, one archer at a time with 20 seconds each: a shoot-off is therefore two shots and a little over 40 seconds on the clock, to which is added the time the judges take to establish which of the two arrows is closer in. There is nothing in this sport that is decided faster, and few things that weigh as much.
There is a third article which looks like a detail and is not: in alternating matches the higher qualifier chooses the order of the first set (not necessarily choosing to shoot first) and in the shoot-off the archer who shot first in that set goes first. A consequence follows from this which I shall return to at the end, and which concerns not so much the rule as the very possibility of studying it.
How often it happens
This is the first number in these pages, and everything else rests on it. Between two archers of similar level (ten points apart out of 720, which in elite archery is a real but not enormous distance) one match in six ends five-all.
In a 64-archer competition 63 matches are shot, so in one afternoon roughly ten shoot-offs take place. Anyone following an international competition from the first elimination round to the final therefore sees the rulebook call for that arrow around ten times, and each time it sends somebody home. This is not a textbook curiosity: it is a scene anyone who follows this sport has watched dozens of times.
2. What a tie-break rule has to decide
Counting errors, however, requires having decided beforehand what counts as an error, and that decision has to be taken here, before looking at any result. The trap is one of those you only see once you have fallen into it: if we were to establish that the better archer is the one who won, then no rule could ever be wrong, the better archer would always win by definition, and the question we set ourselves would dissolve in our hands.
The criterion I adopt is therefore a single one, and I add no others.
The better archer is the one who, stepping onto the line, expects the higher score on average.
Anyone who coaches will object at once that everything else is missing — holding up when the match tightens, reading the wind, the ability to produce the shot that is needed at the moment it is needed — and the objection is well founded. Those qualities are left out, and they are left out precisely where they count most, since no shot in this sport carries more weight than the shoot-off.
In exchange for its poverty, though, the criterion has a quality the others do not have: it can be checked. Expected score is a quantity that can be measured, compared, and tracked from season to season, and two people arguing can agree on that number. The other attributes certainly exist, but nobody has an agreed yardstick for measuring them: taking them as the definition would mean calibrating one instrument by means of a second instrument that is itself uncalibrated.
This is not a neutral choice. If you believe a tournament should reward nerve more than accuracy, then this work is measuring the wrong thing, and the right response is not to correct its numbers but to reject its definition — knowing, however, that you are rejecting the one quality this work has learned to measure.
There is also a finer reason for having chosen expected score rather than, say, group size. The two coincide as long as the archer shoots centred, and diverge the moment he does not: an archer with a very tight group displaced two centimetres from the centre has the smaller group and the worse score, and in that case the right criterion is the second one, because a federation rewards merit and not geometry.
How to read the numbers in this book
Every figure that follows answers the same question: how often the rule sends through the better archer. When I write that a rule is worth 57, I shall mean that out of a hundred matches ending in a tie it gets fifty-seven right and gets the other forty-three wrong.
The ends of the scale have to be fixed now, because every number to come is to be read within them. At the bottom is 50 in 100: what you get by tossing a coin without looking at the target. One thing that is often repeated needs stating properly: if you know that a rule guesses right less than half the time, applying it in reverse takes it back above — but knowing the direction is precisely what you do not have in advance, and chapter 14 exhibits a plausible criterion which, in the situation in which it is consulted, sits below the coin without anyone having noticed. At the top is 100 in 100, which with 15 arrows is never reached, but which serves as a reference.
There is, however, a second way of saying the same thing, and it is needed because the first conceals a defect. A rule can guess right ten times more often than another in a situation that arises once a year, in which case those ten times change nothing. The second way also takes into account how often the occasion arises, and expresses it by counting the matches of a whole competition: 64 archers, 63 matches shot.
When I say a rule is worth a match and a half, I shall mean this: over a complete competition, there are a match and a half in which the winner differs from the one that would emerge by tossing a coin on every tie. Half a match does not exist, of course, and is to be read as an average over several competitions: a match and a half per competition means three matches every two competitions, that is three archers going through on merit rather than by chance, with all the consequences that a changed match has for the rest of the bracket.
The two readings do not convert into each other, and that is why I report both. Moving the winner of any given match is not the same as moving the winner of the final: if the match that changes is in the round of 16, it changes who reaches the quarter-finals; if it is the final, it changes who wins the competition.
When I speak of the competition as a whole I shall use a third formulation, simpler still: how often the title actually goes to the best archer in the field. Today, as we shall see in Part Two, it is one competition in ten.
3. A refresher: the group and its spread
From here on only one tool is needed, and it is this: the group of arrows an archer leaves on the target can be summarised in a single number.
The reason is less exotic than it sounds. Take an archer with no systematic faults — one who does not habitually shoot low, or left, or wide in any recognisable direction: his errors are then distributed evenly in every direction about the centre, as much to the right as to the left, as much high as low, and with the same intensity in every direction. The resulting patch is round, and its centre is where the archer was aiming.
That being so, knowing in which direction an arrow has strayed does not help in identifying who shot it: left and right say the same thing, and what distinguishes one archer from another is only the typical distance at which the arrows come to rest from the centre. That how far is a single number: it is called the spread of the group, it is measured in centimetres, and in statistics it is denoted by the Greek letter sigma. Tight group, small spread, very strong archer; wide group, large spread, archer who misses by more.
Let me fix the scale straight away with something you can look at. An archer whose group measures four and a half centimetres puts two arrows out of three inside a circle as wide as a coffee saucer, a little over thirteen centimetres. The number alone does not suggest this, and it should be kept in mind every time one is read: the patch is always wider than the spread makes it sound.
The target
On the other side there is the target, and that too is simple. The face used at 70 metres is 122 centimetres across and is divided into ten concentric rings all of the same width, 6.1 centimetres each: the innermost is worth ten, the next nine, down to the last, worth one. Inside the ten there is a smaller circle, of 3.05 centimetres radius, called the inner 10 (the X ring), which is worth ten points like the rest of the ring but is counted separately and exists precisely to break ties.
Putting the two together gives you everything: knowing how wide the patch is means knowing how often an arrow falls in each ring, and knowing that means knowing what score is to be expected. The relationship between the two is written in one line, and it is the only formula appearing in the body of these pages because it is the only one whose face needs to be seen:
F(r) = 1 − e^(−r² / 2σ²)
Read it one piece at a time. F(r) is the probability that an arrow falls within a distance r of the centre: it is zero when r is zero, because no arrow strikes the exact point, and it tends to one for large r, because if you widen the circle enough the arrow is sooner or later certain to be inside it. Between the two extremes the curve rises, and sigma governs how fast.
The concrete way to read it is this: a 700-point archer puts seventy-two arrows in a hundred inside the ten (the central six centimetres), while a 630-point archer puts twenty-two there. Over 36 arrows that is twenty-six against eight, and the difference is visible from the sidelines without counting anything. The details are in the appendix, formula S1, and the translation from spread to score is S2; from here on the formula is no longer needed — what is needed are the numbers it produces.
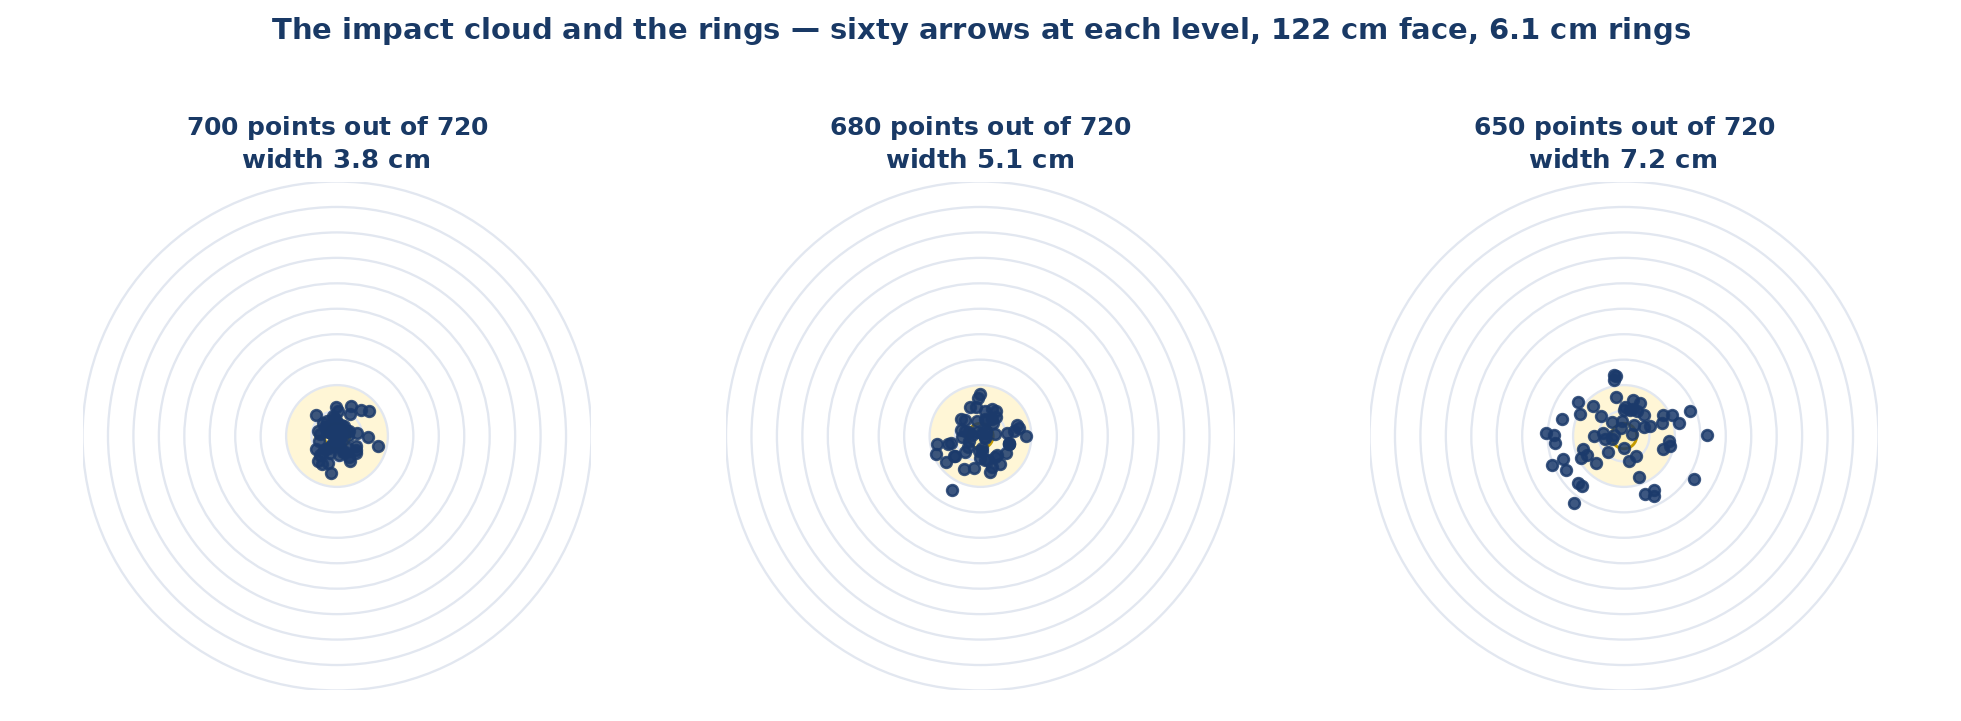
Figure 1 — The group and the rings. Sixty simulated arrows for each of three ability levels — archers of 700, 680 and 650 points out of 720 — on the 122 cm face. The rings are 6.1 cm wide, the X ring has a radius of 3.05 cm. Original schematic representation for teaching purposes. The proportions do not come from a dataset and are not a measurement: they are chosen to make the geometry of the target legible, and no conclusion in this volume rests on them.
4. From score to spread, and back
The relationship can be travelled in both directions, and that is how we shall use it: from a score you recover the spread of the group, and from the spread you calculate everything else. The qualification round at 70 metres consists of 72 arrows, hence a maximum of 720 points.
| Expected score out of 720 | Spread of the group | Roughly who this is |
|---|---|---|
| 700 | 3.78 cm | among the best in the world |
| 690 | 4.46 cm | international finalist |
| 680 | 5.14 cm | international quarter-finalist |
| 670 | 5.81 cm | good national-level archer |
| 660 | 6.49 cm | strong regional archer |
| 645 | 7.50 cm | good competitive archer |
| 630 | 8.52 cm | competitive archer |
(Spread corresponding to each mean score over 72 arrows at 70 metres, obtained by numerically inverting the relationship of the previous chapter. The right-hand column is indicative and serves only to give a sense of scale.)
This table already contains a surprise. Ten points out of 720 sounds like very little, 1.4 per cent of the maximum, and yet they correspond to a difference in spread of 18 per cent if you start from 700 and 15 per cent if you start from 690. The gap in spread depends, in other words, on the level at which it is measured, and for that reason I shall state each time where I am starting from.
It is seen more clearly by putting the two groups side by side on the target. The 690 finalist gathers two arrows out of three in a circle thirteen centimetres across; the 680 quarter-finalist needs one fifteen centimetres across, two centimetres more. On a target that is a difference a coach recognises at a glance, and statistically it is an enormous gap: two archers ten points apart are not two similar archers, they are two archers a good instrument tells apart almost every time. When I say later on that a pair is close, I shall mean two or three points, not ten.
Why every number carries its own level with it
There is a caveat that applies to everything else, and it is the reason every number in these pages carries with it the level it refers to. The translation from points to spread depends on the level: one point is worth 1.81% of spread starting from 700, 1.52% starting from 690, 1.32% starting from 680. The same point, at the top of the rankings, weighs more, because the group is already small and taking a point off it requires widening it by a larger fraction.
Concretely, this means that gaining a point at 700 is harder than gaining one at 680, and anyone who coaches knows this without needing formulas. Without that indication the same number changes by 40 per cent, and anyone re-reading it would get something different.
The reference pair
Many numbers then depend on which two archers are being compared, so I fix a single pair and shall use it wherever possible: a 690 archer against a 680 archer. Ten points apart, which is the distance between a finalist and a quarter-finalist at an international competition — a realistic pair.
Their two groups measure 4.46 and 5.14 centimetres, their ratio is 1.15, and the match between them ends five-all 16.8 per cent of the time: almost one match in six, which in a 64-archer bracket makes 10.6 matches out of 63. Every time a number appears without further indication it will have been computed on this pair.
5. How to compute a match that was never shot
We come to the step nobody usually recounts, and which is in fact the most honest part of this trade. If that match was never shot, on what basis does one state how often a rule identifies its rightful winner?
The route that presents itself immediately is simulation: you instruct a computer to pretend to shoot, have it contest 10 million matches, and count the outcomes. It is legitimate, in many fields it is the only route available, and it has one defect: the result carries a margin of uncertainty with it, because 10 million trials are still a finite number. When the difference to be measured is three matches in a thousand — and in these pages that will happen often — the noise becomes the main problem. Where I could, therefore, I did not simulate: I counted.
The idea can be explained without mathematics, and it is the same one used to work out the probability that two dice give seven: you do not roll the dice, you count the cases. Suppose we want to know how often A’s arrow comes to rest closer to the centre than B’s. There is no need to shoot: we know, for each distance from the centre, with what probability A lands there, and we know the same for B; so for every possible distance of A we compute how probable it is that B falls further out, and we add up all the cases, weighting each by its probability.
A set is the sum of three arrows, and if I know how often an arrow is worth ten, how often nine and so on, I can compute how often three arrows add up to 28, to 27, to 26: it is enough to enumerate all the ways of obtaining each total and add their probabilities. From there one obtains how often A wins a set, how often he draws it, how often he loses it. And a match is a succession of sets, which is worked through like a chessboard with few pieces: you begin at the final outcome, which is known, and work backwards one set at a time, computing the probability of being in each intermediate situation.
There is one detail that simplifies the calculations considerably, and it is not obvious: none of the 51 paths leading to five-all ever touches six points before the end, because with at most two wins the highest score reachable before the last set is five. The rule that stops the match at six therefore never bites on the slice we are interested in.
This way of proceeding has a consequence worth making explicit, and it is the reason the numbers that follow can be attacked profitably: they are reproducible to the last digit. Anyone redoing the calculations tomorrow, to the same specification, would not obtain results similar to mine — they would obtain mine.
6. The paradox of the tie
Before looking at what happens at five-all, look at what would happen without it: that is the quickest way to see where the difficulty really lies. Imagine for a moment that there were no rulebooks, no sets and no shoot-offs: only two archers, a certain number of arrows each, and the freedom to measure the exact distance of every one of them from the centre. Which archer has the tighter group?
| Gap in spread | 3 arrows each | 6 | 15 | 30 | 72 |
|---|---|---|---|---|---|
| 1% | 50.9 | 51.3 | 52.2 | 53.1 | 54.7 |
| 2% | 51.9 | 52.7 | 54.3 | 56.1 | 59.4 |
| 5% | 54.6 | 56.6 | 60.4 | 64.7 | 72.1 |
| 10% | 58.9 | 62.7 | 69.8 | 76.9 | 87.3 |
| 15.2% — the reference pair | 63.0 | 68.4 | 77.8 | 86.1 | 95.4 |
| 20% | 66.5 | 73.1 | 83.8 | 92.0 | 98.5 |
(How often in a hundred the optimal reading identifies the better archer. The columns count the arrows of each archer, not the two totalled: the 15 column is therefore the match as it is shot today, and the 72 column is a qualification round. Over all matches and not only over tied ones; exact closed-form calculation, formula S5.)
The row in bold is our reference pair, and it says something worth reading twice. Looking at the 15 arrows each archer shoots in a match, and reading them in the best possible way, the better archer is identified 78 times in a hundred: over a hundred matches it gets it wrong twenty-two times, a little over one in five. Six arrows each are enough to reach 68, which is already far above the coin, and with the 72 of a qualification round one reaches 95 — one error every twenty.
The conclusion, then, is that without the filter of the tie the problem would be nearly easy: a match contains ample information for telling apart two archers ten points from each other. None of the difficulty we are discussing arises from a shortage of data, and this is the first surprising fact in these pages, because it is exactly the opposite of what one hears on the field.
Where it comes from, then
When a match ends five-all we are not looking at two archers taken at random, but at two archers selected by having produced indistinguishable scores for five consecutive sets. Five-all is not a neutral event that happens: it is a lens that hands us precisely the cases in which the data failed to decide. It is rather like asking how reliable a set of scales is by looking only at the occasions on which it showed the same weight for two different objects — which are by construction the occasions on which it said least.
The effect can be measured, and I measure it on the reference pair, since that is the pair we shall use for everything else.
| Rule | Over all matches | Over five-all matches only | How much it lost |
|---|---|---|---|
| Sum of squared distances | 77.8 | 68.8 | a third |
| Simple mean distance | 76.9 | 67.1 | a little over a third |
| Weighted ring count | 75.1 | 62.7 | almost half |
| Match total score | 74.3 | 60.5 | a little over half |
| Ten count | 71.1 | 53.6 | five sixths |
| Shoot-off arrow | 57.0 | 57.0 | nothing |
(Reference pair 690 against 680. “How much it lost” is the share of the margin above 50 per cent that the conditioning takes away: a rule going from 70 to 60 has lost half of the twenty points it had.)
The right-hand column is the one that tells the story, and it should be read with an understanding of what it measures. A rule that guesses right 70 times in a hundred does twenty times better than the coin; if, looking only at matches that ended tied, it drops to 60, ten of those twenty are left: it has lost half of them. That is the sense in which I speak of how much it lost: not how far the number fell, but how much of its advantage over the coin has evaporated.
Read that way, the table says three things. The rules that read distances lose a third of that advantage, those that read rings lose about half, and the ten count loses five sixths: from 71 it falls to 53.6, which means guessing right fifty-four times in a hundred where a coin would guess right fifty. It is the first sign of something chapter 14 will display in full.
The shoot-off arrow, by contrast, loses nothing. It stands at 57 before and 57 after, and it is the only one of the six of which this can be said.
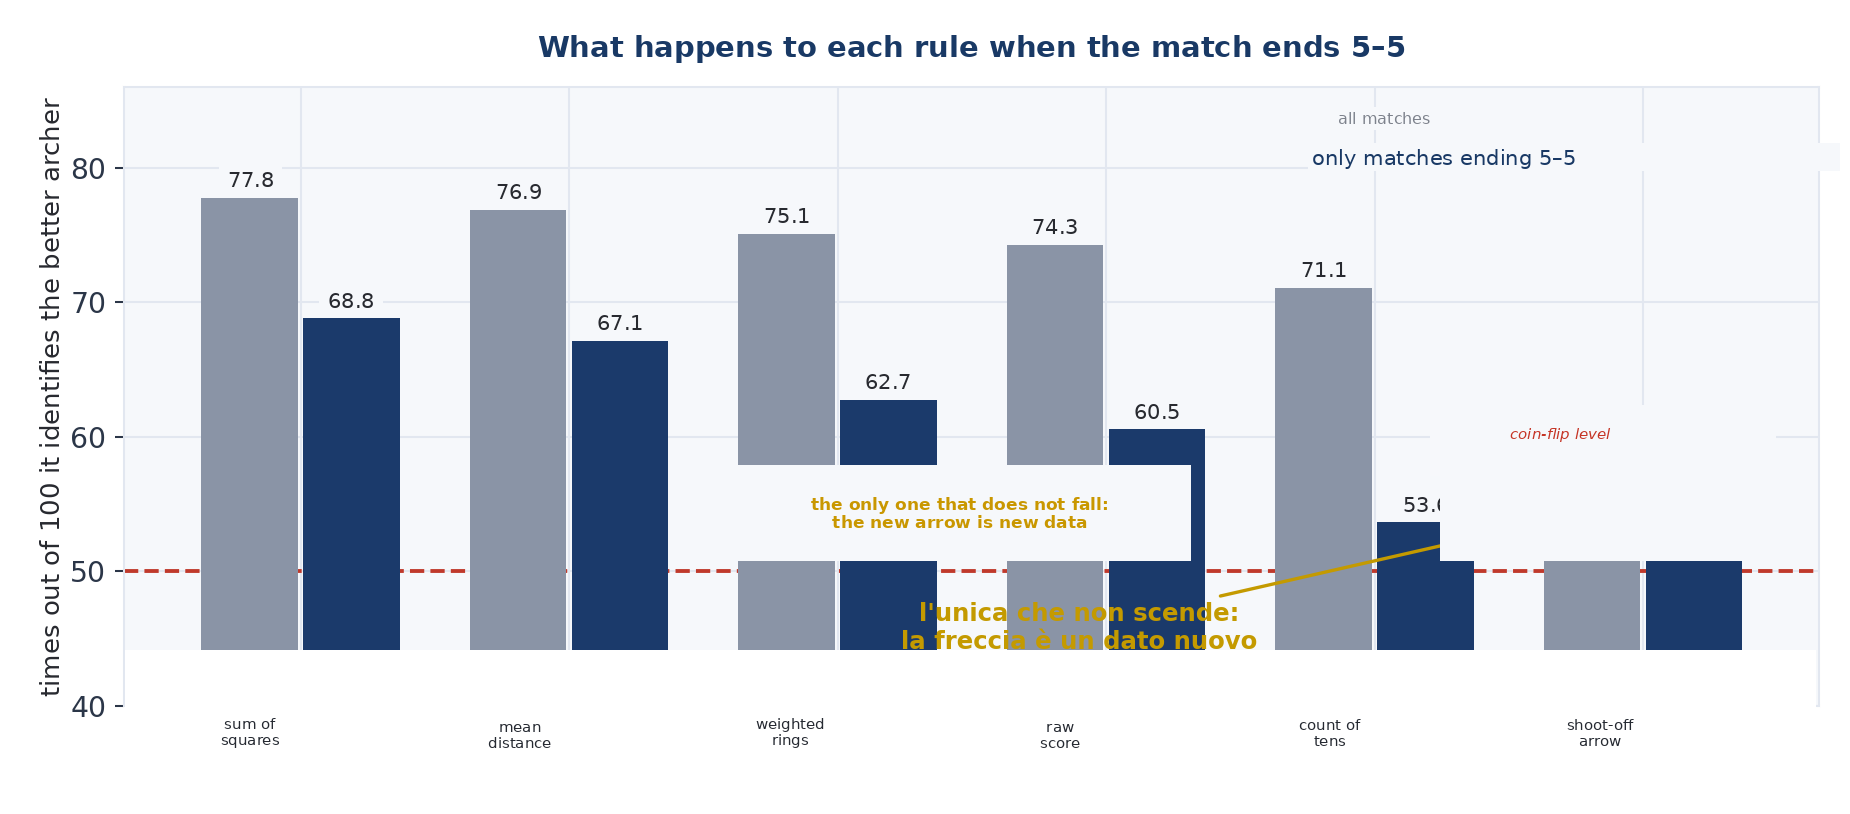
Figure 2 — What happens to each rule when the match ends five-all. How often in a hundred each rule identifies the better archer, over all matches and over tied matches only. Reference pair 690 against 680. The shoot-off arrow is the only one that does not fall, and the ten count is the one that comes closest to the coin.
7. Why the arrow loses nothing, and why that is not enough
That the arrow preserves everything is not a lucky accident, and it is one of those things that can be shown in two lines and are then never forgotten. The shoot-off arrow is shot when the match is already over: it did not contribute to producing the tie, it is not part of it, and it has no relation to it other than coming afterwards.
Asking that arrow to decide therefore means asking a piece of data that has not yet been spent; asking the fifteen already shot to break the tie they themselves produced is a different matter, because one is asking a piece of data to say something we already know it did not say. In formal terms: looking only at tied matches does not touch anything unrelated to that tie, and that is formula S4.
This would seem to be an argument in favour of the rule in force, and it is not — indeed it is the misunderstanding on which much of the discussion rests. Because the arrow does preserve everything — but everything, here, amounts to very little. On the reference pair it guesses right 57 times in a hundred and gets the other forty-three wrong, and it does not move from there either before or after the tie. The other rules start from 71, 74, 78, far higher, and then come down. The right question, at this point, is not which rule preserves the most but which ends up highest after losing what it has to lose.
Why the arrow separates the best archers so poorly
There is a fact about the arrow worth recounting, because it is unusually clean and because it is useful later. The probability that the arrow identifies the better archer can be written in closed form, and it is governed by a single quantity: the ratio between the spreads of the two groups. Calling that ratio ρ, the probability is ρ² divided by 1 + ρ², and nothing else enters the calculation (formula S8) — not the shooting distance, not the width of the rings, not how tight the match is. For our pair the ratio is 1.15, and that formula gives 57.0.
This also explains why the shoot-off discriminates so poorly among the best, and moving up a level shows it. Between a 690 finalist and a 685 archer the ratio between the groups falls to 1.076, and the arrow guesses right 53.6 times in a hundred: out of twenty shoot-offs it gets more than nine wrong. In an Olympic final, where the two archers are closer still, it drops below 53, which means a rule distinguishable from a draw only by watching dozens of finals.
The arrow is not imprecise because it is a single arrow: it is imprecise because it has to tell apart two groups that resemble each other very closely, and with one shot there is no way to do that. A judge asked to say which of two groups was the tighter while looking at one arrow from each would be in the same position, and nobody would ask him to answer.
The two facts on which the whole of Part One rests
Let us return to the table in the previous chapter and read its middle column, the one for tied matches only, which is the only population a tie-break rule ever acts on.
The first fact is that the match total score guesses right 60.5 times in a hundred and the arrow 57. The total — the sum of the 15 arrows, which is already written on the scorecard and which the rulebook ignores entirely — sends through the right archer three and a half more times in every hundred ties. Over a competition with ten shoot-offs that is one archer every three competitions going through on merit rather than by chance, and the sum is already there, on the judge’s table. And it beats the arrow even while leaving its own ties unresolved, which, as we shall see, are a third of the cases: if those too were given an answer, the gap would widen.
The second is that the ten count, the criterion anyone would propose first, guesses right 53.6 times in a hundred: it does worse than the arrow by three and four tenths, and it is a whisker away from the coin. Out of a hundred matches ending five-all it gets fifty-three right and forty-seven wrong, whereas tossing a coin would get fifty right, so everything that criterion adds, relative to tossing a coin, is three and a half matches in every hundred ties. We shall see in chapter 14 that this is not merely a weak criterion.
One clarification about how to read those numbers, because it will be useful throughout the volume. The rules that can tie (the total, the ten count) do not always decide, and in those cases I have credited half a point, treating the residual tie as though it were settled with a coin. It is a conservative convention: a real rule would have to settle them somehow, and any sensible way is better than a coin. The total at 60.5 is therefore its value on its own and not the value of the rule that could be built on top of it, which will be higher.
8. How much there is to gain, at most
Before comparing the rules one has to know how much margin there is altogether, otherwise one discovers that a rule guesses right 57 times in a hundred and cannot tell whether that is a lot or a little, because one does not know whether the maximum was 58 or 90.
The calculation is done by taking the best conceivable rule — the one that, knowing everything, errs as little as possible — and looking at how far it moves the outcome relative to a coin. The result depends on two things that pull in opposite directions: how often the tie occurs, which falls as the gap between the two archers grows, and how well the rule can settle it, which by contrast rises. The product of the two is the quantity that matters, and I call it the gain (formula S10).
The unit needs a moment, because this is the point at which it is easiest to get lost. The gain is not how often the rule guesses right: it is by how much it shifts the probability that the better archer wins the match, taking into account how often it is needed. A perfect rule acting on a situation that never arises would have zero gain, and it is the same reason an excellent provision covering a rare case does not change the sport.
| Gap between the two | How many matches end tied | Maximum gain |
|---|---|---|
| none | 21.40% | 0.00 points |
| 3 points | 20.68% | 1.48 points |
| 6 points | 19.18% | 2.66 points |
| 8 points | 17.87% | 3.19 points |
| 11 points | 15.68% | 3.66 points |
| 13 points | 14.15% | 3.74 points |
| 17 points | 11.17% | 3.58 points |
| 25 points | 6.31% | 2.52 points |
(Anchor level 700, parameterised in points. Gain in percentage points on the probability of winning the match, with the optimal reading on coordinates. The second decimal place is uncertain by about two hundredths.)
The first column reads as follows: between two identical archers about one match in five ends five-all, and between two separated by twenty-five points about one in sixteen.
The shape of the right-hand column is the first structural result in these pages, and it should be looked at before the values: it starts at zero, rises, and then comes back down, with the maximum at around a 14-point gap. The reason is clear as soon as you see it. If the two archers are identical there is nothing to tell apart, and no rule can do better than a coin; if they are very far apart the tie hardly ever occurs, and a rule acting on a rare event shifts nothing.
Put in terms of competitions: between two archers twenty-five points apart the match ends tied once in sixteen, so in a 64-archer bracket four shoot-offs are shot instead of ten, and over four occasions even the perfect rule has little room to work. The tie-break rule matters only within an intermediate window of gaps, and even there it matters little.
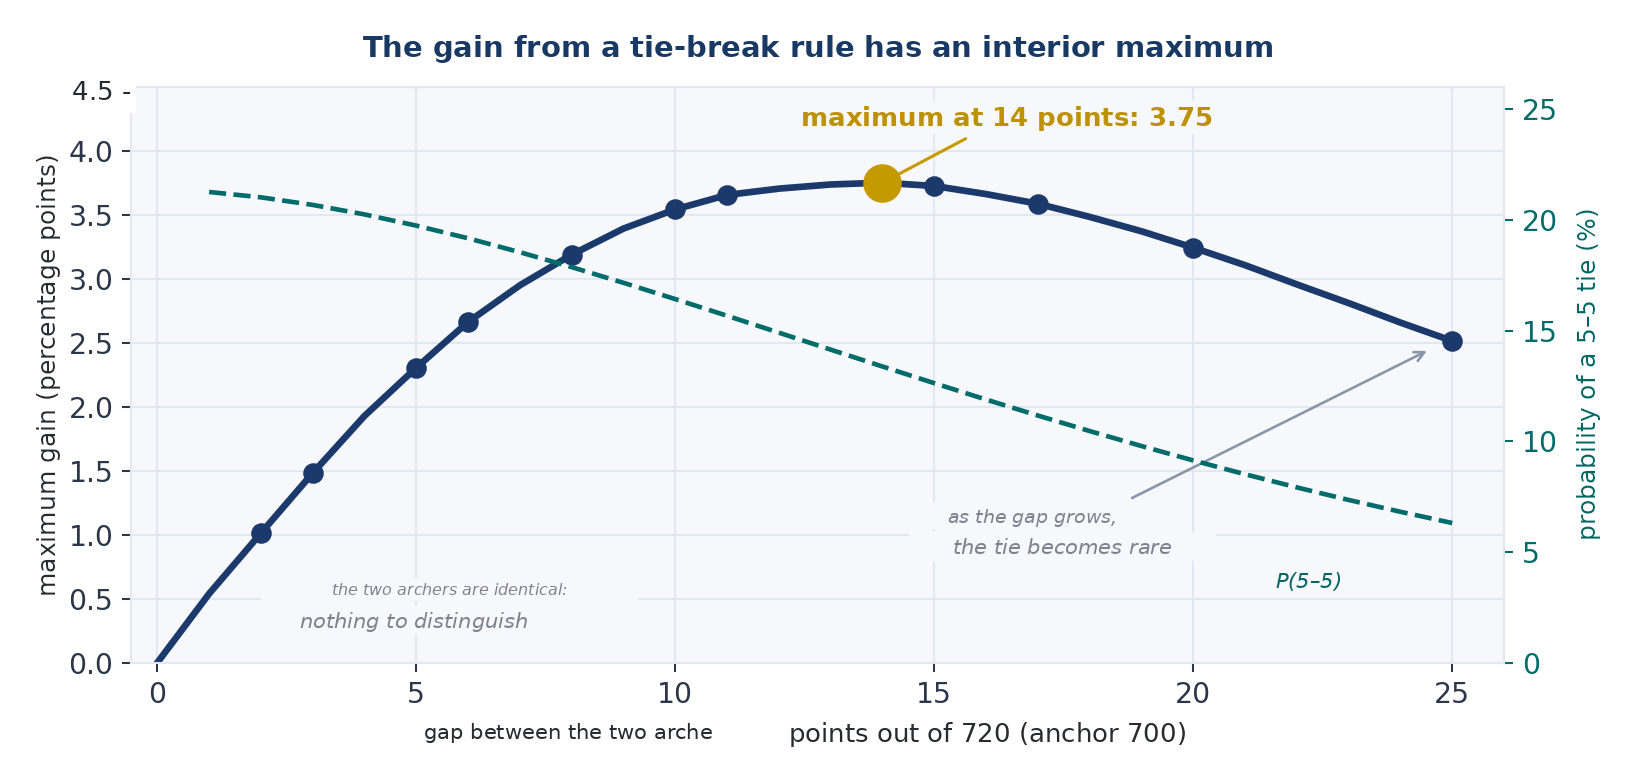
Figure 3 — The gain from a tie-break rule has an interior maximum. Product of the probability of five-all and the capability of the optimal rule on coordinates, in percentage points on the probability of winning the match. Anchor level 700, parameterised in points. The curve is zero at zero gap and tends to zero for large gaps; the maximum is at 14 points and is worth 3.75. Dashed, the probability of ending five-all.
9. The four ceilings
That maximum of 3.75, however, presupposes something no rulebook provides for: being able to measure the exact coordinates of every arrow in the match. A competition scorecard records the value of the ring (a nine is a nine), not the position within the ring. That number is therefore a theoretical limit and not a target, and the number that matters to anyone who has to write a rule is a different one. I have computed four of them, one for each set of things a rule might be allowed to look at.
| What the rule is allowed to look at | Maximum gain | Permitted today |
|---|---|---|
| Match coordinates plus shoot-off arrow | 4.00 points | no |
| Match coordinates | 3.75 points | no |
| Match rings plus shoot-off arrow | 2.88 points | yes |
| Match rings only | 2.31 points | yes |
| Rule in force: the shoot-off arrow alone | 1.47 points | in force |
(Maximum gain over the gap, in percentage points of probability of winning the match. Anchor level 700.)
The first operational conclusion is in the third row compared with the last: the rule in force realises about half the margin the rulebook would already allow to be captured. The ratio is 1.48 to 2.88 at the point where each reaches its own maximum; on the reference pair, where the gap is ten points and not thirteen, the fraction realised falls to 46 per cent. Between 42 and 53 depending on the pair, then, and the half measure is an average and not a constant.
The second conclusion is read in the fourth row, and I have not found it stated anywhere in the debate. Reading the scorecard already sitting on the judge’s table, without making anybody shoot anything, yields 56 per cent more than making two tired athletes shoot one more arrow. The sum is already written, the judge has it in front of him, and it is being ignored in order to demand one further performance from the two archers.
What that means on a shooting field
Here the number stops being abstract, so let me reconstruct the scene in full.
In a 64-archer competition 63 matches are shot. Between opponents like our reference pair, about ten end tied and have to be settled by a tie-break rule. A coin would send the right archer through in half of them, that is five: that is the floor, and it is needed in order to read everything that follows.
The shoot-off arrow, which is the rule in force, directs five and three quarters of them correctly. It therefore gains three quarters of an archer per competition over chance: across four competitions, three archers go through on merit rather than luck, and in the fourth the rule moved nobody.
The best rule the current rulebook would allow would direct six and six tenths correctly, that is one and six tenths of an archer more than the coin. Relative to today the gain is a little under one archer per competition: across five competitions, four more archers go through on merit. That is everything at stake in the tie rule: keep it in mind for the rest of the book.
Measuring distances from the centre instead of rings would get to seven, that is two archers more than the coin. So not even the absolute maximum moves two matches out of 63: over a whole competition, with ten shoot-offs shot, the difference between the worst imaginable rulebook and the best possible one is two archers.
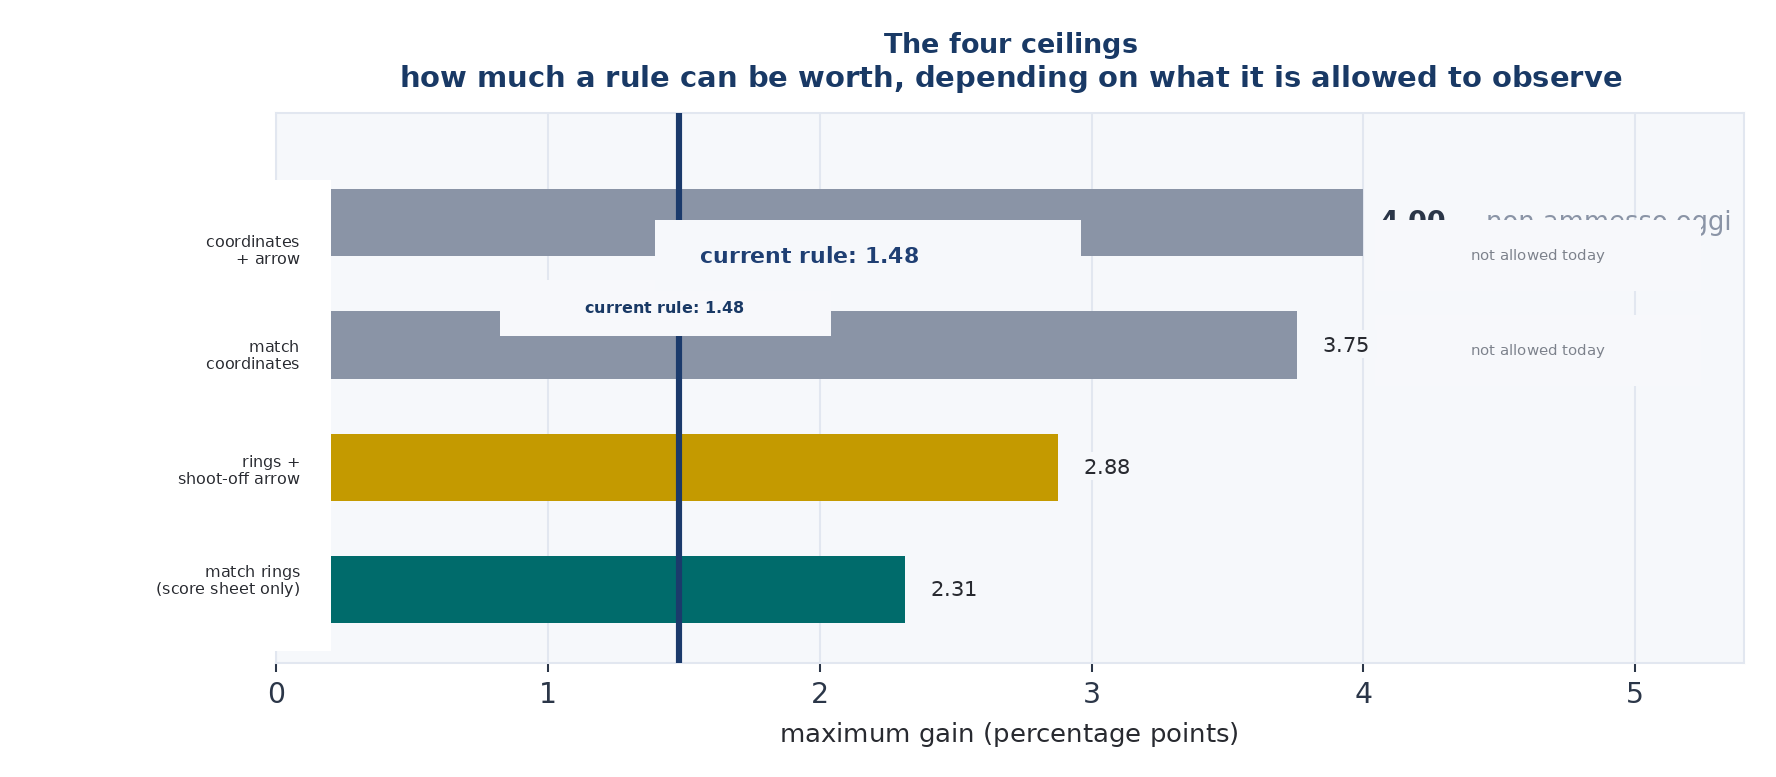
Figure 4. The four ceilings. Maximum gain in percentage points according to what the rule is allowed to look at, with the row for the rulebook in force highlighted. Exact calculation on the pair that maximises each ceiling, anchor level 700, ceiling taken at the maximum over the gap.
10. Fourteen ways to decide, one by one
With the ceiling fixed, the question becomes concrete: what are the possible ways of deciding a tied match, and what is each of them worth. I have tested fourteen, and they are worth describing before being lined up, because the table on its own explains nothing.
The draw is proposed by nobody, but it serves as the floor: it guesses right 50 times in a hundred by definition, and every other rule is to be judged on how far above this it stands.
The shoot-off arrow is the rule in force, and it guesses right 57 times in a hundred. Its merit is that it uses new data, uncontaminated by the tie; its defect is that those data are a single arrow, and a single arrow says little.
The ten count looks at who shot more tens in the match, and in the event of a tie who shot more Xs. It is the criterion tradition considers most natural (more arrows in the centre, therefore better shooting) and it guesses right about 55 times in a hundred — less often than the arrow. Chapter 14 will show that the problem runs much deeper than that.
The match total score adds the 15 arrows and gives the win to whoever has more points. It is the proposal almost everybody makes first, and it is a reasonable one: if the set format throws away the information about the margin by which sets were won, the total recovers all of it. It guesses right 60.5 times in a hundred even while leaving its own ties unresolved, so it already beats the rule in force; but on its own it is not enough, and chapter 13 explains why.
The count of arrows below nine counts the arrows of eight and under and gives the win to whoever has fewer. The idea is that a thrown-away arrow says a great deal about the width of the group, while the difference between a nine and a ten says little. It guesses right 59.3 times in a hundred on its own, and 62.4 with the shoot-off arrow appended for ties: it is one of the better proposals, and the easiest to verify from the stands, since it is a matter of counting the bad arrows.
The count of arrows below ten is the same idea with the cut moved by one ring — the arrows that are not tens are counted — and it guesses right 55.9 times in a hundred with the arrow appended: 6.5 fewer correct decisions per hundred ties than the previous version, for a single ring of difference, and the reason for that gap is the subject of chapter 11.
The X count on its own guesses right 56.3 times in a hundred, below the rule in force: the X is a very fine and very rare criterion, and it separates little.
The cascades are the rules that consult several criteria in sequence until one of them decides. The classic cascade (total first, then the ten count, then Xs, then the arrow) guesses right 59.7 times in a hundred; the reversed one, which consults tens before the total, 57.67. The difference between the two is the first hint of the reversal we shall see shortly.
Removing the ten count from the cascade — consulting the total, then Xs, then the arrow — takes it up to 62.1: better than either cascade, which already tells us that the ten count was not adding information but removing it. And removing the Xs as well, leaving only two stages (total and then arrow), it rises further, to 62.9. I shall call this TOTAL+ for short: it is the proposal of these pages, and chapter 17 explains it in full.
CONCUR is a rule unlike the others: if the total and the ten count point to the same archer, that archer wins, and if they contradict each other, an arrow is shot. It guesses right 58.9 times in a hundred, and it is not a rule for accuracy but an insurance policy against one specific eventuality, which chapter 21 describes.
The weighted ring count, instead of giving a nine nine points and an eight eight, gives each ring the weight that ring really deserves for telling two archers apart. It guesses right 62.7 times in a hundred, and 64 with the arrow appended: it is the most accurate of all those that read only the rings on the scorecard. It stays below the ceiling of chapter 9, which is 65.16, and the difference is not a defect of this rule: the ceiling also looks at the distance of the shoot-off arrow, which the rulebook already measures, and combines it with the rings instead of using it as the last word. No judge performs that combination at the table, and that is why it remains a ceiling and not a proposal. The weighted count does, however, have a defect that no gain compensates for, and I discuss it in chapter 12.
The sum of squared distances, finally, measures how far from the centre each arrow lies, squares it and adds, giving the win to the lower total. It guesses right 68.8 times in a hundred, far above all the others. It requires measuring coordinates, however, which is not done today, and it is the only route that would genuinely take us out of this narrow margin, so it deserves a chapter of its own.
Here they all are together, in the same units.
| Tie-break method | Right per 100 ties | Archers moved per competition | Shoot-offs shot per competition |
|---|---|---|---|
| Draw | 50.0 | +0.00 | 0.0 |
| Ten count, then Xs | 54.96 | +0.52 | 0.7 |
| Arrows below ten, then arrow | 55.9 | +0.63 | 3.5 |
| X count alone, then arrow | 56.15 | +0.65 | 2.1 |
| Shoot-off arrow (in force) | 57.0 | +0.74 | 10.6 |
| Reversed cascade: tens, total, Xs, arrow | 57.67 | +0.81 | 0.4 |
| CONCUR | 58.93 | +0.95 | 0.8 |
| Classic cascade: total, tens, Xs, arrow | 59.69 | +1.03 | 0.4 |
| Total, then Xs, then arrow | 62.09 | +1.28 | 0.7 |
| Arrows below nine, then arrow | 62.44 | +1.31 | 4.7 |
| Weighted ring count | 62.7 | +1.34 | 0.0 |
| Weighted count with estimated dispersion | 62.7 | +1.35 | 0.0 |
| TOTAL+ (total, then arrow) | 63.0 | +1.37 | 3.64 |
| Weighted count, then arrow | 64.00 | +1.48 | 1.9 |
| The best obtainable within the rulebook | 65.16 | +1.60 | 10.6 |
| Sum of squared distances | 68.8 | +1.99 | 0.0 |
(Reference pair 690 against 680, 64-archer bracket with 63 matches. The population for the first column is matches that ended five-all; the second says how many additional archers, per competition, go through on merit rather than by chance; the third how many shoot-offs are shot over a whole competition. Ties credited at one half where the rule can tie.)
The full ranking should be read with a clear understanding of what it represents. The optimality of the weighted count at known parameters is a result internal to the model: the weights are built from the logarithms of the likelihood ratios of the ring probabilities under the two profiles considered. A rule that directly incorporates the model can therefore exploit nearly all the information available, but it inevitably inherits the consequences of any misspecification of that model as well.
That is why I publish the complete ranking and, at the same time, do not build the main recommendation on its most sophisticated part. The more a rule knows the model, the more it can gain when the model is right and the more it can lose when the model is wrong. The match total, by contrast, does not require knowing the shape of the distribution, does not depend on weights derived from model parameters, and reads a directly observable statistic: for that reason it starts out with less structure to defend outside the model.
If I had to make a prediction today about what will survive contact with independent empirical data, I would say: the top of the ranking more than its fine ordering. I expect the closely spaced positions to be reshuffled, some weighted rules to give back part of the advantage obtained inside the model, and TOTAL+ to remain competitive to the point of emerging not only as the best rule at minimum informational cost, but as the best rule overall in the relevant empirical domain. That is a prediction, not a result of this volume, and I write it down precisely so that it can be confirmed or refuted.
Nine of the fourteen beat the rule in force, which therefore sits not in mid-table but in the bottom third. Between the worst and the best of the adoptable proposals there is about nine tenths of an archer per competition: over ten competitions, nine different archers reach the next round depending on which row is chosen.
And there is one fact the table displays without explaining: adding stages does not help. The classic cascade, with two more criteria than TOTAL+, gets it right about three ties in a hundred less often, and on top of that it reduces the shoot-offs shot from three and six tenths to four tenths per competition — from an afternoon with four shoot-offs to one with none, almost always. You pay on both axes to add a criterion, and the reason lies in the chapter that follows.
11. The weights the rings would deserve
The key to the whole of the previous table is a difference I left hanging: counting arrows below nine guesses right 62.4 times in a hundred, counting those below ten 55.9. Two identical rules but for where the cut is placed, and six and a half times’ difference per hundred ties for one ring of displacement.
To understand it one has to look at how much it is really worth, for the purpose of telling two archers apart, to know that an arrow landed in one ring rather than the next. That value can be computed, and it is what I call the weight of the ring.
| Ring | Weight it deserves | Points the rulebook gives |
|---|---|---|
| ring 0 — miss | 0 | 0 |
| ring 1 | 1.9 | 1% |
| ring 2 | 3.6 | 2% |
| ring 3 | 5.1 | 3 |
| ring 4 | 6.3 | 4 |
| ring 5 | 7.4 | 5% |
| ring 6 | 8.3 | 6 |
| ring 7 | 9.0 | 7 |
| ring 8 | 9.5 | 8 |
| ring 9 | 9.9 | 9 |
| ring 10 | 10% | 10% |
(Optimal weights for the reference pair, rescaled to the interval from 0 to 10 for direct comparison with the rulebook’s points. The concave shape does not depend on the pair chosen and is proved in the appendix, formula S7.)
The weights are not linear: they are concave. The step from zero to one is worth 1.9 points, the one from nine to ten 0.15, twelve and a half times less. Put without scales: knowing that one archer threw an arrow away and the other did not says twelve times more about the difference between them than knowing that one shot a ten where the other shot a nine.
And it makes sense the moment it is said out loud. Telling a thrown-away arrow from a mediocre one says a great deal about the width of the group, because only a wide group produces arrows like that; telling a nine from a ten says almost nothing, because two archers of similar level both shoot plenty of tens and plenty of nines, and the boundary between those two rings falls exactly where their groups resemble each other most.
From here the whole of the previous chapter’s table can be read in a single line. Three rules, three different choices about that same ring: the simple total weights nine-against-ten as a full point, which is too much; the count of low arrows weights it zero, because it throws away every distinction above the cut, which is too little; the optimal weights put it at 0.15. And the order of merit of the rules is exactly the order of how closely each approaches that 0.15.
Comparing the rules at the same stage — each on its own, with no arrow appended — the weighted count guesses right 62.7 times in a hundred, the total 60.5, the count of low arrows 59.2 and the ten count 53.6. The order is that of the approximation to the correct weights, and the ten count, which puts all its weight on the least informative ring, comes last.
A rule is only as good as its approximation to the correct weights. And the correct weights say that a thrown-away arrow counts for far more than a missed ten.
This also explains why adding stages makes things worse. Every additional stage is a criterion deciding on an ever smaller subset, and on that subset the criterion has to beat the alternative that would come next. The ten count, inserted after the total, decides on the matches in which the total tied, and there, as we shall see, it not only fails to beat the arrow: it does worse than the draw.
12. Measuring distances: the road nobody has tried
If the optimal weights work so well, the natural question is why not adopt them. And behind that lies a more radical one: why not measure distances directly, instead of reading rings. They are two different proposals, and I shall separate them.
The first: adopting the weighted count
It guesses right 64 times in a hundred with the arrow appended, the most accurate of all those that read only the rings on the scorecard, and it requires no new instrumentation: it is computed on the numbers the judge already has in front of him.
It has, however, a defect that no gain compensates for. The weights depend on who is on the line (two elite archers and two club archers do not have the same weights), and this means that the judge would have to compute them, which no judge does at the table. But above all it means that an archer who loses cannot reconstruct why he lost: he would have to have it explained to him that his nine was worth 9.9 and his opponent’s eight 9.5, and take the word of whoever is explaining it. In a sporting rulebook this is not a convenience, it is the condition for the rule to be accepted, because a decision an athlete cannot verify is a decision he will have to accept on trust, and trust at an international competition is a scarce commodity.
I tried to save it. There is a version that estimates the archers’ level from the scorecards themselves, with no need to know it in advance, but how matters, because that choice decides everything: the common level is obtained from the total of the thirty arrows on the two scorecards taken together, and the weights are computed on a pair separated by a declared nominal gap (formula S6, second part).
The clarification is not pedantry. If instead one estimates each archer’s spread from his own scorecard alone, the version collapses: when the two totals coincide — and in a match ending five-all that happens one time in three — the weights vanish and the rule stops deciding, going on to err one time in ten. With the estimate on the common level the two versions decided differently 52 times out of 50,468,034 tied matches: once in a million, or once every twenty thousand international seasons. The technical problem therefore dissolves; the problem of verifiability remains untouched.
The second: measuring coordinates
This is more radical, and it is the only proposal in these pages that moves the ceiling rather than merely approaching it. Recording for every arrow not only the ring but the exact distance from the centre raises the ceiling: in a competition of 63 matches one goes from one and eight tenths of an archer moved relative to chance to two and a half. Forty per cent more, and it is the only way past the wall every other proposal runs into.
It would require targets with electronic reading of the point of impact, or a system for scanning the faces after each end. The technology exists; automatic detection systems capable of transmitting the impact position have been trialled in competition, although I do not have a systematic review of their use. The real question is how much precision is needed, and the answer can be computed in two lines.
The measured position is the true one plus an instrument error, and the sum of two round groups is a round group: measuring with an error of spread ε is equivalent to reading two archers whose groups are the square root of σ² plus ε². The effect is not that the distances get noisy; it is that the ratio between the two groups is compressed towards one, and the signal with it — the instrument makes the two archers look more alike than they are.
On the reference pair an error of 3 millimetres takes the ratio from 1.15157 to 1.15094 and what the rule can distinguish from 27.80 to 27.71 in a hundred: three tenths of one per cent — one three-hundredth of what the rule is worth is lost. Over tied matches alone, which is the population the rule acts on, the loss is about three times greater, from 18.80 to 18.61 — one per cent — because the filter of the tie has already removed almost all the difference between the two, and the little that remains is more fragile.
For anyone drafting a procurement specification, the law is this: the loss grows with the square of the ratio between instrument error and group spread, with a coefficient of 0.71 that is constant across the whole useful range. Two per cent loss is reached at 7.5 millimetres looking at all matches, and at around 4 looking at five-all matches only; at one centimetre of error three and a half per cent is lost, and nobody would build an instrument to one centimetre.
Put concretely: an instrument that errs by half a millimetre more or less than a judge reading a ring by eye is more than sufficient. Laboratory precision is not needed, field precision is, and this is the number that says which.
The rule would become, literally: the archer with the smaller sum of squared distances wins. The square is not arbitrary — it follows from the likelihood ratio between the two hypotheses, which is formula S3 — and it is the reading that extracts the maximum of the available information. It also has a property none of the others possesses: applying it requires knowing nothing. Whatever the pair of archers, the rule is always the same; the judge has nothing to estimate and the calculation is an addition.
The verifiability problem remains, and I do not want to hide it: an archer does not recompute a sum of squares by eye. But he can see the numbers, and that is a substantial difference. If the board shows 412.7 against 428.3, the decision is inspectable in a way that a computed weight is not: they are two sums of fifteen numbers, each read by an instrument the athlete can contest exactly as he contests the reading of a ring today.
I cannot estimate the cost and I do not pretend to. But the question a federation should ask itself is not how much it costs, rather how much it costs relative to what it buys — and now at least the second term is measured.
13. The cascade, and why it looked like the answer
With the weights of chapter 11 in hand, and the distances of chapter 12 set aside as a road to be travelled one day, the question becomes practical again: what is the best rule among those a federation could adopt tomorrow morning, without buying anything?
For weeks I believed I had it, and it was the classic cascade: the total first, then the ten count if the total ties, then Xs if that ties too, and only if all three tie is an arrow shot.
The reasoning looks solid. The total guesses right 60.5 times in a hundred against the arrow’s 57, but on its own it is not enough because it ties too often: out of a hundred matches ending five-all, the total of the 15 arrows coincides in 34 cases. Put in terms of a competition, that means that out of ten shoot-offs the total would be silent in three or four, and in those cases the judge would be left without an answer. A rule that fails to decide in a third of cases is not a rule, and the obvious solution is the one every sporting rulebook uses in other contexts: the criteria are lined up, from the most informative to the least, and one works down until one of them decides.
On the reference pair the cascade guesses right 59.7 times in a hundred against the 57 of the rule in force. It always decides, it requires no instrumentation, it does not lengthen the competition, and it can be computed by hand on a scorecard in 20 seconds. It looked like the answer, and for weeks I treated it as such.
Then, for a reason that had nothing to do with the substance, it turned out to be wrong.
14. The reversal: when counting tens points to the wrong archer
The discovery came from changing the unit of measurement, not from looking for anything.
I had spent weeks expressing every result in an analyst’s currency: by how much the probability shifts that the better archer wins the match. Then, to make these pages readable to people who do not do this for a living, I redid the same table in the other currency (out of a hundred matches ending five-all, how often the better archer goes through) and in the new currency the table contained an impossible row: the cascade came out below the total score.
It could not be. If the ten count were even slightly informative, substituting it for the coin on those matches could only improve matters. An impossible row is not an odd row: it is a row saying that something does not add up. I measured it, and this is the result that rewrote the whole of Part One.
On matches that end five-all and in which the totals are level too, and under the dispersion model this volume adopts, the ten count points to the wrong archer. Not less well: to the wrong one, more often than to the right one. On the reference pair it sends the better archer through 44.7 times in a hundred, which means it sends the weaker one through fifty-five: a coin flipped in the air would do better, and applying the rule in reverse would do better still.
And it is not a local effect of one particular pair, as the exact — not simulated — calculation over the whole grid shows.
| Pair | How often the totals tie | Ten count | Tens, then Xs | Shoot-off arrow |
|---|---|---|---|---|
| 700-695 | 46.52% | 48.70 | 52.19 | 54.30 |
| 690-685 | 37.2% | 47.47 | 48.81 | 53.65 |
| 690-680 | 34.4% | 44.66 | 46.79 | 57.01 |
| 690-670 | 28.1% | 38.97 | 41.79 | 62.94 |
| 680-660 | 24.4% | 38.82 | 40.10 | 61.47 |
| 660-640 | 19.45% | 40.58 | 41.02 | 59.35 |
| 650-620 | 15.2% | 38.09 | 38.46 | 62.21 |
| 640-600 | 12.16% | 36.57 | 36.88 | 64.39 |
(Out of a hundred matches ending five-all with the totals level. Exact calculation, no simulation error. Ties within the criterion credited at one half.)
The whole column sits below 50, from the 48.70 of the mildest case to the 36.57 of the most marked. In the worst row, counting tens sends the better archer home in sixty-three cases out of a hundred: anyone applying it systematically would do better to decide with a coin, and better still to reward the archer with fewer tens. Adding Xs repairs nothing, because the column beside it stays below 50 almost everywhere.
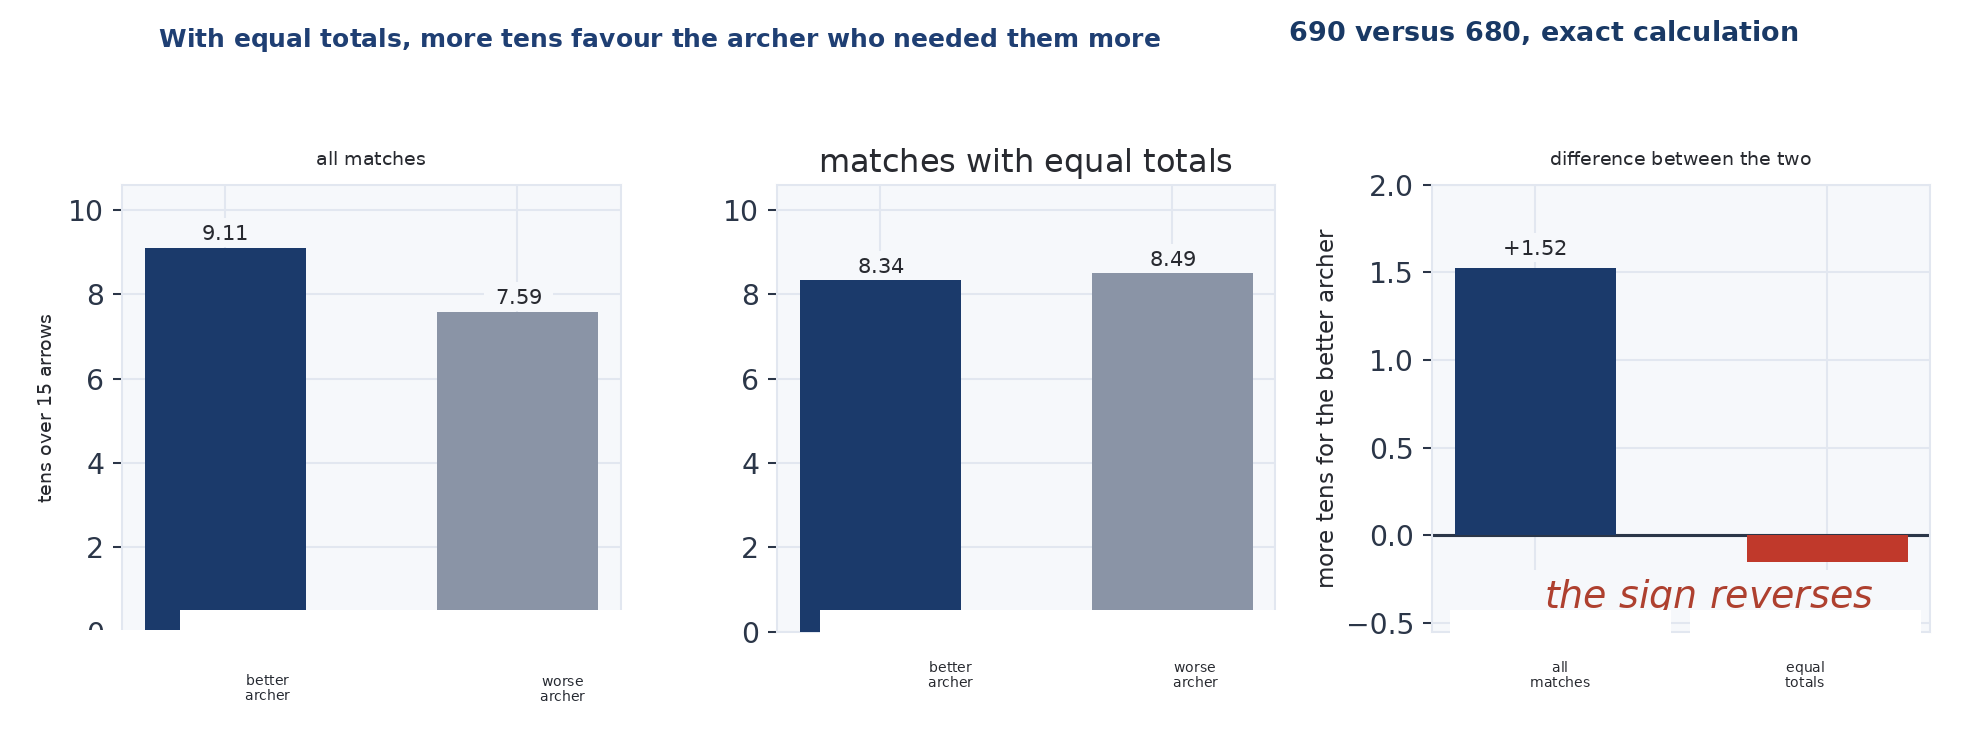
Figure 5 — The reversal of the ten count. Mean number of tens over 15 arrows for the two archers, unconditioned and conditioning on level totals, with the difference between the two in the third panel. Pair 690 against 680, exact calculation. The difference goes from +1.52 to −0.15: the sign flips.
15. The explanation, which is arithmetic and not statistical
The reason is simpler than the result leads one to fear, and once seen it is obvious. Two tables are enough, and the only difference between them is which matches are looked at.
Looking at all the matches the two archers play, the picture is the expected one.
| Better archer (690) | Weaker archer (680) | |
|---|---|---|
| Tens per 15 arrows | 9.110 | 7.588 |
| Arrows of 8 or less | 0.357 | 0.894 |
(Expected values, exact calculation under the standard model.)
The better archer shoots more tens (nine against seven and a half out of fifteen arrows) and throws away less than half as many arrows as the other. All normal, and what anybody standing behind the shooting line would expect.
Now let us look only at the matches in which the totals are level, which is the only situation in which the criterion would ever be read; in the qualification round it is what remains after the Xs have tied as well.
| Better archer (690) | Weaker archer (680) | |
|---|---|---|
| Tens per 15 arrows | 8.343 | 8.495 |
| Arrows of 8 or less | 0.443 | 0.587 |
(Same archers. The only difference from the previous table is which matches are looked at.)
The weaker archer shoots more of them. It is not an artefact and it is not noise, and the mechanism can be stated in one sentence. If two archers arrive at the same total and one of them arrives there with more tens, that archer must have given those points back somewhere else, because the total is fixed and does not create itself out of nothing: the missing points concentrate on the remaining arrows, which are fewer.
An example makes it plain. Two archers finish the match on the same total. The first gets there with nine tens and six nines; the second shot eleven, but to level that total he had to put two very low arrows somewhere. Whoever looks at the ten count rewards the second. Whoever looks at the target sees that the second threw two arrows away and the first none.
Exactly where the missing points end up — on a few low arrows or on many mediocre ones — is not imposed by the arithmetic, and scorecards running counter to the pattern can be constructed on paper. In scorecards generated by the model the route is almost always the same: the correlation between the two differences, measured over those matches, is 0.9898. Put without jargon, the link is nearly iron-clad: practically every time an archer has more tens than the other at an equal total, he also has more arrows thrown away.
It follows that if two archers have the same total and one has more tens, that one is the archer who needed more tens to get there: the one who threw more away. Which leads to the correct statement, and it is far stronger than “the ten count is a weak criterion”.
At a fixed total, the ten count does not measure who shot better: it measures who concentrated his deficit on fewer arrows (formulas S11 and S12). Under the standard model, concentrating the deficit is precisely what the weaker archer does, and the rest follows from there. In that situation, the ten count correctly measures the wrong thing.
The check that says which kind of tie is at work
The mechanism predicts something that can be checked. If the reversal arises from the constraint on the total, it should not depend on the five-all: it should be enough for the totals to be equal, regardless of how the sets went.
I redid the calculation asking only that the totals be level, without asking that the match had ended five to five, and the result holds across the whole grid: 48.4 on the mildest pair, 44.2 on the reference pair, 38.3 on the widest. The discrepancies from the previous table lie between two and seven tenths: five-all shifts things very little.
It is the levelling of the totals that matters, not the five-all. Which has a practical consequence for a rulebook: the reversal would strike the ten count wherever it is used to break a tie on the total, and in the rulebook in force there is only one such place — ordinary ties in the qualification rankings, where Xs are looked at first and then tens. For ties deciding access to the elimination rounds, and for matches, the rulebook prescribes a shoot-off instead, and there the criterion does not come into play. It is not a defect of the format: it is a defect of the criterion.
And there is one final layer, which makes the fact more than a technical curiosity. The ten count is never consulted in an ordinary situation: it is looked at after a tie has been established, which is to say exactly when the total has already fallen silent. So one is not applying a good criterion in an unfortunate situation: one is applying a criterion in the only situation in which that criterion inverts. It is not that the wrong population happened to come along — the rule itself creates it.
16. Where the reversal holds, and where it stops holding
A result of this kind has to be bounded, otherwise it gets extended to places where it does not hold. I made three checks, and all three teach something.
The first concerns the X ring: does it behave the same way? No, and the reason confirms the mechanism instead of contradicting it. The X is a subdivision within the ten ring, and an X and a ten are both worth ten points; moving from one to the other therefore requires nothing to be given back to the total, and the arithmetic constraint does not touch it. Indeed the X count, on matches with level totals, remains informative on the top pairs: it guesses right 53.9 times in a hundred at 700 against 695, 53.1 on the reference pair, 54.3 at 690 against 670.
The second check follows from that: if the X is informative, is it worth using as the second criterion after the total? The answer is no, and I did not expect it. On those same matches the shoot-off arrow is worth more than the X (57 against 53), so inserting the X between the total and the arrow makes things worse rather than better.
| Pair | Total, then arrow | Total, then Xs, then arrow | Total, then 10, then X, then arrow |
|---|---|---|---|
| 700-695 | 57.33 | 57.49 | 56.65 |
| 690-680 | 62.95 | 62.09 | 59.70 |
| 690-670 | 73.68 | 72.02 | 68.06 |
| 660-640 | 68.80 | 67.27 | 65.37 |
(Out of a hundred matches ending five-all. Anchored at the first of the two scores. Exact calculation.)
And there is a second cost, less visible. With the X in the middle, the shoot-off is hardly ever needed: from a range of between 19 and 47 per cent of ties to one of between 5 and 8. In a 64-archer competition that means going from two or five shoot-offs shot to fewer than one — almost always none. You pay in accuracy and spectacle together in order to add a stage.
The general conclusion is that when the total falls silent, a fresh arrow beats the residual criteria I tested, the X count and the ten count. That it beats any function derivable from the scorecard is not something I demonstrate.
The third check asks where it stops holding for the X as well. The answer is that the X remains informative as long as its ring is large relative to the group: moving down in level the group grows, the X ring becomes relatively small, and at a certain point the X inverts too. The crossing occurs when the radius of the X stands to the spread of the group as 0.52 to one (formula S14), which corresponds to a level of about 670 points out of 720. Above that level the X is useful, below it inverts like the ten count: the same rule, applied at a national competition instead of a world final, changes sign.
The threshold does shift a little with the gap between the two archers, though, and I report it in full rather than picking the convenient value: with 5 points of difference the crossing is at 667 points and at a ratio of 0.508; with 10 points at 669 and 0.522; with 20 points at 673 and 0.547. The further apart the two archers, the higher the threshold goes, and the reason is the same one governing this whole chapter: the useful information lies where the two groups resemble each other least.
It is interesting that the same ratio also governs another phenomenon in this work — how much it costs to read rings instead of coordinates — and that the two thresholds fall in the right order: first ring-reading begins to cost information, then it begins to invert the sign. Had they come the other way round we would have had a problem.
17. The proposal, and why it works
If the ten count is to be excluded, the cascade simplifies itself and only two stages remain. The rule fits in one sentence.
In the event of a tie on sets, the archer with the higher total score in the match wins. If the totals are level as well, one arrow each is shot and the arrow closer to the centre wins.
I call it TOTAL+ for short, and before defending it I shall show what it is worth.
| Pair | Arrow (today) | Cascade | TOTAL+ | The best obtainable | Fraction realised |
|---|---|---|---|---|---|
| 700-695 | 54.3 | 56.6 | 57.3 | 58.1 | 90% |
| 690-685 | 53.6 | 55.1 | 56.7 | 57.9 | 85% |
| 690-680 | 57.0 | 59.70 | 62.95 | 65.2 | 85% |
| 690-670 | 62.95 | 68.06 | 73.7 | 77.4 | 87% |
| 680-660 | 61.5 | 66.85 | 71.9 | 75.7 | 86% |
| 660-640 | 59.4 | 65.37 | 68.80 | 72.38 | 84% |
(Out of a hundred matches ending five-all. Anchored at the first of the two scores. The fraction realised is relative to the best obtainable within the rulebook, counting up from the floor of 50 per cent.)
TOTAL+ takes between 84 and 90 per cent of everything the rulebook allows to be taken, against the 42–53 per cent of the rule in force. But the number on its own convinces nobody, and the part that actually defends the proposal is a different one: why it works.
A match ending five-all is not a match in which the two shot equally well. It is a match in which they won and lost the sets in the right order to end level, something that can happen even with fifteen points of difference on the total. That total, however, is still there on the scorecard, and it says something. The question is how much.
| Total margin | How often it happens | How often the total is right | How often the arrow is right |
|---|---|---|---|
| 0 points — level | 34.4% | 50.48 — does not decide | 57.0 |
| 1 point | 40.8% | 60.8 | 57.0 |
| 2 points | 17.4% | 71.3 | 57.0 |
| 3 points | 5.6% | 80.7 | 57.0 |
| 4 points | 1.5% | 87.8 | 57.0 |
| 5 points or more | 0.4 | 93.4 | 57.0 |
(Reference pair 690 against 680, population of matches ending five-all, 2 million simulated matches. The right-hand column reports the theoretical value: the shoot-off arrow is independent of how the match went, so it is 57.0 on every row by construction. A simulation returns it between 56.8 and 58.5 on the rows with few cases, and those oscillations are noise — publishing them would suggest an effect that does not exist.)
This table is the explanation, and it should be read looking at the two right-hand columns side by side.
The arrow’s column is constant: 57 on every row. This is not a rounding but a consequence of what the arrow is: it is shot afterwards, it knows nothing about how the match went, and its ability to identify the better archer cannot therefore depend on the margin by which the total closed. It is the argument of chapter 7 seen from another angle.
The total’s column, by contrast, rises. With one point of margin it is right six times out of ten, with two points seven, with three eight, with four almost nine. And the two columns cross at once: at a single point of margin the total already beats the arrow, and one point is the commonest difference of all, because it occurs in four out of ten of the matches that end tied.
Adding up the rows, the picture is this: in two cases out of three the total says something, and when it speaks it is right between six and nine times out of ten; in the third case it is silent, and there the arrow is worth 57 against the 50 of a coin. TOTAL+ uses the better criterion in each of the two situations, instead of using one of them in both. That is all there is to it: the rule in force always makes them shoot, even when the scorecard already knew the answer.
What changes in one competition, and over twenty years
In a 64-archer competition the rule in force moves the winner in three quarters of a match relative to chance, and produces 10.6 shoot-off arrows. TOTAL+ moves it in one match and four tenths, and has three and six shoot-off arrows shot. Nearly double the accuracy with a little over a third of the shoot-offs.
Over a championship lasting twenty years that is some thirty matches whose winner changes, and a hundred and forty fewer shoot-off arrows to be shot: thirty archers who, over twenty years, go through on merit rather than luck.
In titles won it is far less, and I say so before someone else does. This change on its own shifts the probability of the title going to the better archer by three and a half tenths of a point per edition, less than one title in twenty years. It is the reason the reckoning is done on matches and not on titles: the tie rule acts often, but almost never on the final — even though it can change who takes part in it.
18. How the article would be drafted
A proposal that does not get as far as the text of the article is not a proposal, because all the work lies in the cases the text has to cover. Here is how I would draft it.
Article — Resolution of a tie on sets
1. Where, after 5 sets, the score is five set points for each athlete, the match shall be won by the athlete who has scored the higher total number of points over the 15 arrows of the match.
2. If the two athletes have scored the same number of points, each shall shoot one arrow within the time allowed by the rules for a single arrow: twenty seconds in alternating shooting; thirty in simultaneous shooting at World Ranking and announced events, forty at all others, reducible to thirty by the organiser. The match shall be won by the athlete scoring the higher value; where the values are equal, by the athlete whose arrow is closer to the centre of the target; and if the distance too fails to separate them, the procedure shall be repeated.
3. If the two arrows are judged equidistant, the procedure under paragraph 2 shall be repeated until a decision is possible.
4. The shooting order for the procedure under paragraph 2 shall be determined by a draw of lots conducted by the judge in the presence of both athletes.
5. The match total referred to in paragraph 1 shall be that resulting from the scorecard already completed for the 5 sets, without further verification. Each athlete shall have the right to inspect it before the decision is announced.
Five paragraphs, and each answers a question a judge would ask.
The first is the rule, and it requires no new data: the total is already on the scorecard, because in order to award the set points the judge has already had to add up each set. The second keeps the shoot-off arrow where it is genuinely needed — when the scorecard does not decide — and it leaves the shooting times currently in force untouched. The third covers the double-tie case with the same mechanism as the present rulebook, introducing nothing new.
The fourth is the only substantive change to current practice, and I propose it for a reason that has nothing to do with accuracy. Today the archer who shot first in the first set goes first in the shoot-off, and the order of that set is chosen by the higher qualifier, who may choose to shoot second, and sometimes does. Who shoots first therefore depends on the seeding and on the preference of whoever is choosing, and the two remain entangled: anyone wanting to study whether going first is an advantage could not separate them. Recording the choice would be enough to make the question answerable from the data, and drawing lots for the order costs nothing and makes it answerable with the data a federation already collects.
The fifth protects verifiability, which is the reason this rule is preferable to others that are more accurate: the athlete who loses must be able to see the number that eliminated him.
As for what would change in competition practice, the answer is almost nothing, and that is the point. The judge already has the completed scorecard and has to add two columns of fifteen numbers, or more simply read two totals the electronic scoring system already computes. In two cases out of three the decision is quicker than it is today, because it does not require bringing two athletes back to the shooting line.
19. How much spectacle you want to buy
There is an objection to TOTAL+ that has to be met rather than sidestepped: it makes two shoot-offs out of three disappear. Today 10.6 are shot in a competition, with TOTAL+ 3.6: an afternoon with ten of those moments becomes an afternoon with three or four. Anyone who defends that scene because it is the moment the crowd waits for has a legitimate argument, and these pages do not deny it.
But the choice is not all-or-nothing, and that is the result of this chapter. TOTAL+ is one point on a curve, and the curve is obtained by generalising the rule in one line: the match total is used only if the margin is wide enough, otherwise an arrow is shot. With a minimum margin of one point you get TOTAL+; raising the threshold sends more and more matches to the shoot-off, until the rule in force is recovered.
| Minimum margin for using the total | Right per 100 ties | Archers moved per competition | Shoot-offs per competition | Share of ties going to a shoot-off |
|---|---|---|---|---|
| 1 point (= TOTAL+) | 63.0 | +1.37 | 3.6 | 34% |
| 2 points | 61.4 | +1.20 | 8.0 | 75% |
| 3 points | 58.9 | +0.95 | 9.8 | 93% |
| 4 points | 57.7 | +0.81 | 10.4 | 98% |
| no limit (= rule in force) | 57.0 | +0.75 | 10.6 | 100% |
(Reference pair 690 against 680, 64-archer bracket with 63 matches. The margin is the difference between the two 15-arrow totals.)
The second row is the one to look at, compared with the last. With the threshold at two points, eight shoot-offs out of ten are kept and the rule still guesses right four and four tenths more times per hundred ties than today. The crowd sees almost the same competition as now, and in the meantime half an extra archer per competition goes through on merit.
Which dismantles the trade-off as it was posed. It is not true that accuracy and spectacle are mutually exclusive: the stark choice between reading the scorecard and shooting the arrow was an artefact of having considered only rules that decide everything one way or everything the other.
What comes out of this, for a federation, is a dial with the prices written on it. Anyone wanting maximum accuracy sets the threshold at one and accepts dropping to three and a half shoot-offs per competition; anyone wanting to keep the spectacle sets it at two, keeps eight of them, and pays less than two tenths of an archer per competition — one archer every six competitions. Anyone who wants to change nothing now knows what it costs. In the text of the article the variant is written by changing three words in the first paragraph — “has scored at least two points more” — and adjusting the second.
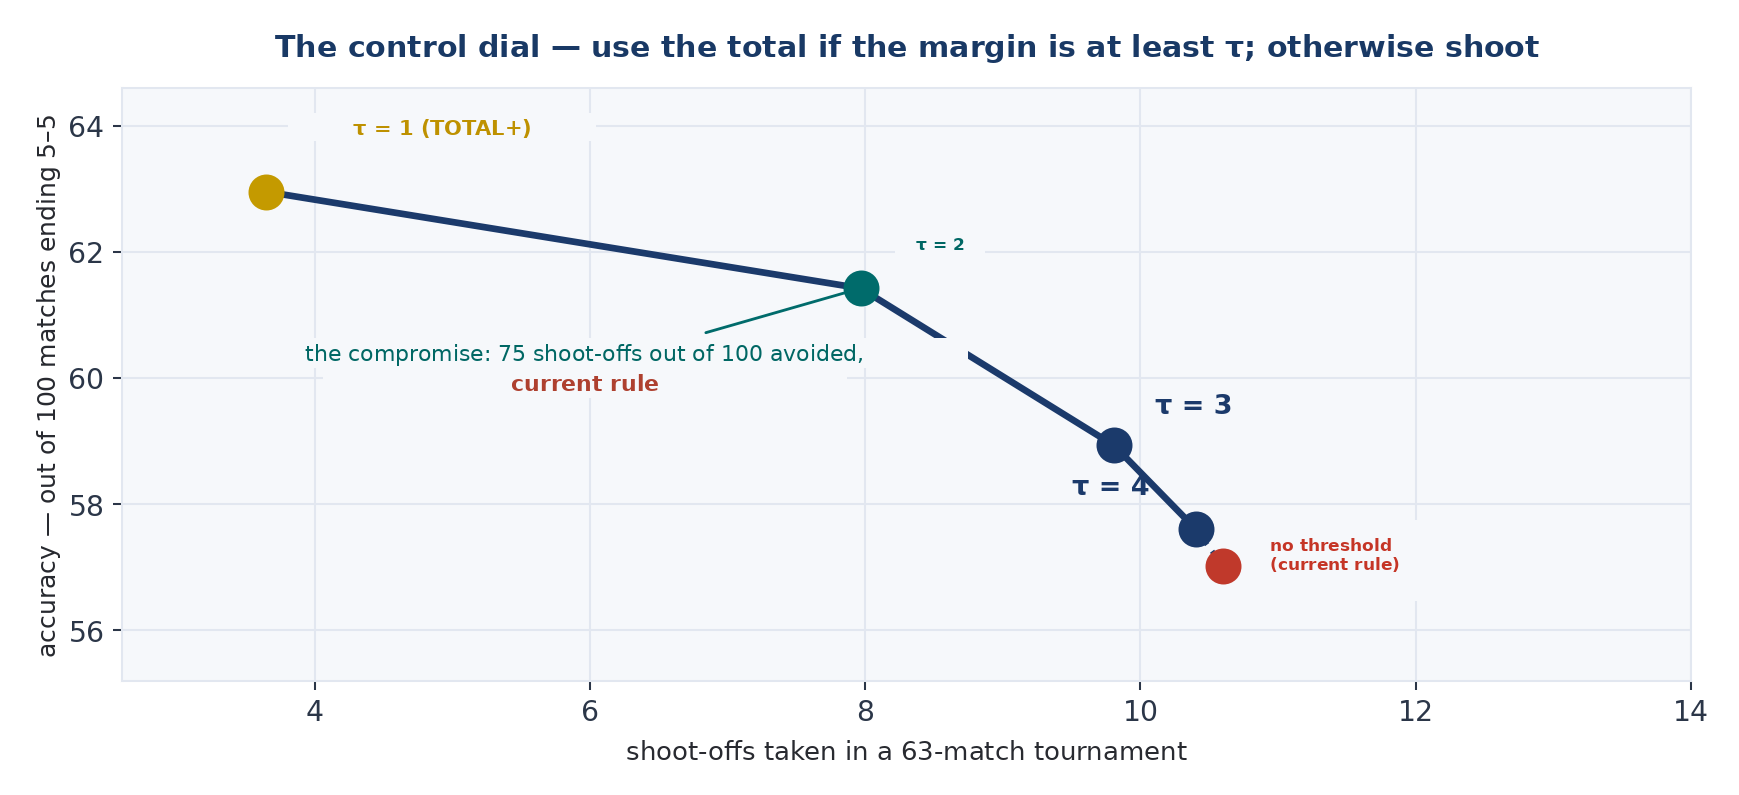
Figure 6 — The dial. Accuracy against number of shoot-offs, as the minimum margin τ required for using the match total varies. Reference pair 690 against 680, population of matches ending five-all; the shoot-offs are over a 63-match tournament. The right-hand end is the rule in force, which amounts to never using the total.
20. If archers were not as we have described them
So far we have assumed something quite specific: that arrows arrange themselves in a round group, centred, with tails that fall away quickly. It is the standard model and for small errors it works very well.
But every archer knows it is not always so. There is the arrow that has nothing to do with the others, the one that got away badly, the one where the shot collapsed, the one that met a gust at the wrong moment. And the bell-shaped model is extremely unforgiving about such events: for a 690-point archer it places an arrow below the seven once in 3 million — never in an entire career. Anyone who spends time on a field knows that is not the case.
Let us call it a tail and take it into account. I checked all the previous conclusions under five departures from the standard model (heavy tails, off-centre group, elliptical group, drift during the match, common environmental conditions), and the main result is that the reversal of the ten count disappears when the tails are heavy enough.
It was predictable from the mechanism. The tail adds ways of composing the same total (formula S13): if an arrow can end up a long way out, the iron-clad link between more tens and more low arrows loosens, because a single arrow thrown away can offset a good many tens. And the two things move together cell by cell, which confirms that the mechanism is the one described.
| Generating model | Ten count | How tight the arithmetic constraint is |
|---|---|---|
| standard | 46.80 | 0.998 |
| light tail (1% of arrows) | 48.97 | 0.888 |
| medium tail (3%) | 52.60 | 0.831 |
| marked tail (6%, very wide) | 59.32 | 0.547 |
(Pair 700–690, on matches with level totals. Above 50 the criterion becomes informative again.)
With three anomalous arrows in every hundred the criterion goes back above the coin, and with six in every hundred it guesses right almost six times out of ten: in the world of marked tails, counting tens is a sensible rule, and in the standard world it is worse than a coin. The direction of the conclusion therefore depends on a number we do not know.
But not all departures have the same effect, and this is the part that took the most work. The off-centre group does not remove the reversal: it deepens it, from 46.80 to 41.76 when the centre of the group is displaced by one spread. Nor does the elliptical group, and the shape has to be stated: the two semi-axes stand in a ratio of 3.2 with the geometric mean preserved (the square root of the product of the two dispersions remains σ), so that the value 1 reproduces the standard model exactly and the overall dispersion does not change. Without that parameter the calculation cannot be redone: with a ratio of 2 the same calculation gives 46.73 instead of 46.02.
What, then, distinguishes the departures that matter from those that do not? Not how much mass drops into the low rings, but whether it drops there concentrated on few arrows. The proof is a purpose-built pair of cases with the same quantity of low arrows and opposite behaviour.
| Type of departure | Arrows of 8 or less | Arithmetic constraint | Ten count |
|---|---|---|---|
| many arrows displaced a little | 0.2112 | 0.991 | 45.78 |
| few arrows displaced a lot | 0.2114 | 0.715 | 49.07 |
(Pair 700 against 690, population restricted to five-all matches with level totals. The two configurations are constructed to have the same mass in the low rings.)
The same low mass to the fourth digit, opposite behaviour: concentration is the mechanism, not quantity.
Translated for anyone who has spent time on a field, what matters is the difference between two archers everybody recognises. There is the one who shoots slightly wide all day, who finishes with plenty of eights and no disasters. And there is the one who shoots beautifully and every so often throws an arrow away, who finishes with a lot of tens and a six. The first leaves the scorecard tied to the total, the second unties it, and it is the second who makes the ten count useful — which is counter-intuitive, because he is also the one the crowd would call the better of the two.
21. An insurance policy, not a rule
Which of the two worlds is ours? Do elite archers shoot slightly wide, or do they throw an arrow away every so often?
The honest answer is that we do not know, and there is a structural reason why we probably never will. The information about how marked the tail is lies in events that are rare by definition (arrows thrown a long way away), and estimating that number to the precision required takes about ten thousand arrows per athlete. That is 140 qualification rounds: an archer shooting one a week would take nearly three years, and no quantity of additional competitions changes the fact that the information lies in events that are rarely observed.
There is a rule that gets around the problem rather than solving it, and it comes from an elegant idea. It is called CONCUR, and it works like this: if the total and the ten count point to the same archer, or if only one of the two decides, that archer wins; if both are decisive and they contradict each other, the match goes to a shoot-off.
An example. A shoots 145 with 6 tens, B shoots 143 with 7 tens: the total says A, the tens say B, they disagree and the match goes to a shoot-off. If instead A shoots 145 with 7 tens against 143 and 6, the two criteria agree and A wins without shooting. And if the totals are level at 144 and the tens are 7 against 5, the only criterion that speaks decides, so the archer with more tens wins.
The idea comes from a fact that can be proved by checking every case: two rules differing only in the order in which they consult the total and the ten count diverge if and only if both criteria are decisive and discordant. Outside that set of cases they are the same rule. The whole open question therefore lives on a subset a judge recognises at a glance from the scorecard, and on that subset we do not know which of the two criteria is right. So one does not choose: one shoots.
| Generating model | Rule in force | TOTAL+ | Cascade | CONCUR |
|---|---|---|---|---|
| standard | 57.01 | 62.95 | 59.70 | 58.93 |
| light tail | 57.01 | 61.74 | 59.32 | 59.16 |
| medium tail | 57.01 | 60.04 | 58.79 | 59.62 |
| marked tail | 57.01 | 53.27 | 53.41 | 59.30 |
| elliptical group | 57.01 | 62.12 | 60.42 | 59.04 |
| off-centre group | 57.01 | 64.05 | 60.20 | 57.90 |
(Out of a hundred matches ending five-all, pair 690 against 680. Each row is a different generator; the rule in force does not change by construction, because the arrow is independent of the match.)
The row in bold is the one that counts. Under a marked tail TOTAL+ falls to 53.27, below the rule in force, while CONCUR holds at 59.30. CONCUR is therefore not an alternative to be preferred: it is cover to be bought if one fears a configuration one cannot ascertain, and the premium on the policy is known — four times in a hundred given up if the world is the standard one.
Anyone who bets on the standard model and is wrong does not merely lose the gain: he loses what he had as well, because he ends up below the rule he wanted to replace. Over a whole competition, winning the bet is worth between four and six tenths of an archer and losing it costs between five and eight: one risks slightly more than one stands to win.
The decision therefore has four terms, and none of the four would suffice on its own: the gain is modest, the loss is slightly larger, the bad branch falls below the rule one wanted to replace, and the number that decides which of the two worlds is ours cannot be ascertained.
There is, however, one thing in TOTAL+’s favour that the reckoning of stakes does not capture, and that narrows the risk considerably. The tail that damages it is not just any tail: it is the concentrated one. Off-centre group, elliptical group and drift do it no harm at all — indeed, under an off-centre group TOTAL+ is the best of the lot, at 64.05. The fan opens along one axis only, and the set of dangerous configurations is smaller than the table makes it look.
22. The five rules left standing
At this point there are several reasonable rules and none that beats the others on everything. The correct way to present them is not a ranking (a ranking is a choice of weights dressed up as a result) but the list of those that no other rule beats on all criteria at once. There are seven criteria: expected accuracy, worst-case accuracy, time added to the competition, instrumentation required, decisiveness, public verifiability, shoot-offs preserved.
| Rule | Wins on | Pays on |
|---|---|---|
| Weighted count, then arrow | the highest accuracy, and few shoot-offs | not inspectable, and the most fragile if the model moves |
| TOTAL+ | the best of those that can be verified by eye | robustness no better than the rule in force |
| Dial with threshold 2 | keeps three quarters of the shoot-offs and still gains | less accurate than TOTAL+ |
| Rule in force | the maximum of shoot-offs preserved, and the best behaviour under a marked tail | the lowest accuracy in the standard model and in almost every configuration tested |
| CONCUR | the best worst case | almost no shoot-offs, lowest expected accuracy |
(Five of the seven non-dominated vertices of the seven-criterion frontier, reference pair.)
How does one choose among the five? Not with a calculation, and I say so plainly: the choice is political and not technical, because it requires weighing spectacle against accuracy and there is no objective way of doing that. What the calculations can do is say what each choice costs, and now they do.
Three things, though, the calculation does say, and they narrow the field.
The first is that the rule in force is beaten by all four of the others under the standard model, and by CONCUR under a marked tail as well. It is not, however, the worst in every configuration: under a marked tail it is the best of the three that read the scorecard, and its row in the table should be read with that exception alongside. If it were kept, it would be kept for the spectacle and for nothing else, and now that price is known. For completeness: there is one configuration in which the rule in force is not the worst, and it is the one discussed in the previous chapter: under a marked tail TOTAL+ falls to 53.3 and the cascade to 53.4, both below the arrow’s 57.0. That is the reason that chapter exists, and the reason the choice among the five is not obvious.
The second is that the weighted count, which is the most accurate, cannot be proposed: a decision the athlete cannot reconstruct does not hold up at an international competition.
The third is that between TOTAL+, the dial and CONCUR the choice depends on two questions a federation can answer and a researcher cannot: how much the shoot-off is worth as a piece of spectacle, and how much one fears that archers have marked tails.
There is, finally, a regularity appearing here for the third time and which will return in the other two parts as well: the rule that is most accurate under the nominal model is also the most fragile the moment the model moves. The weighted count estimates dispersion by assuming the model, so it inherits the model’s error; the crude rules do not, because they assume nothing.
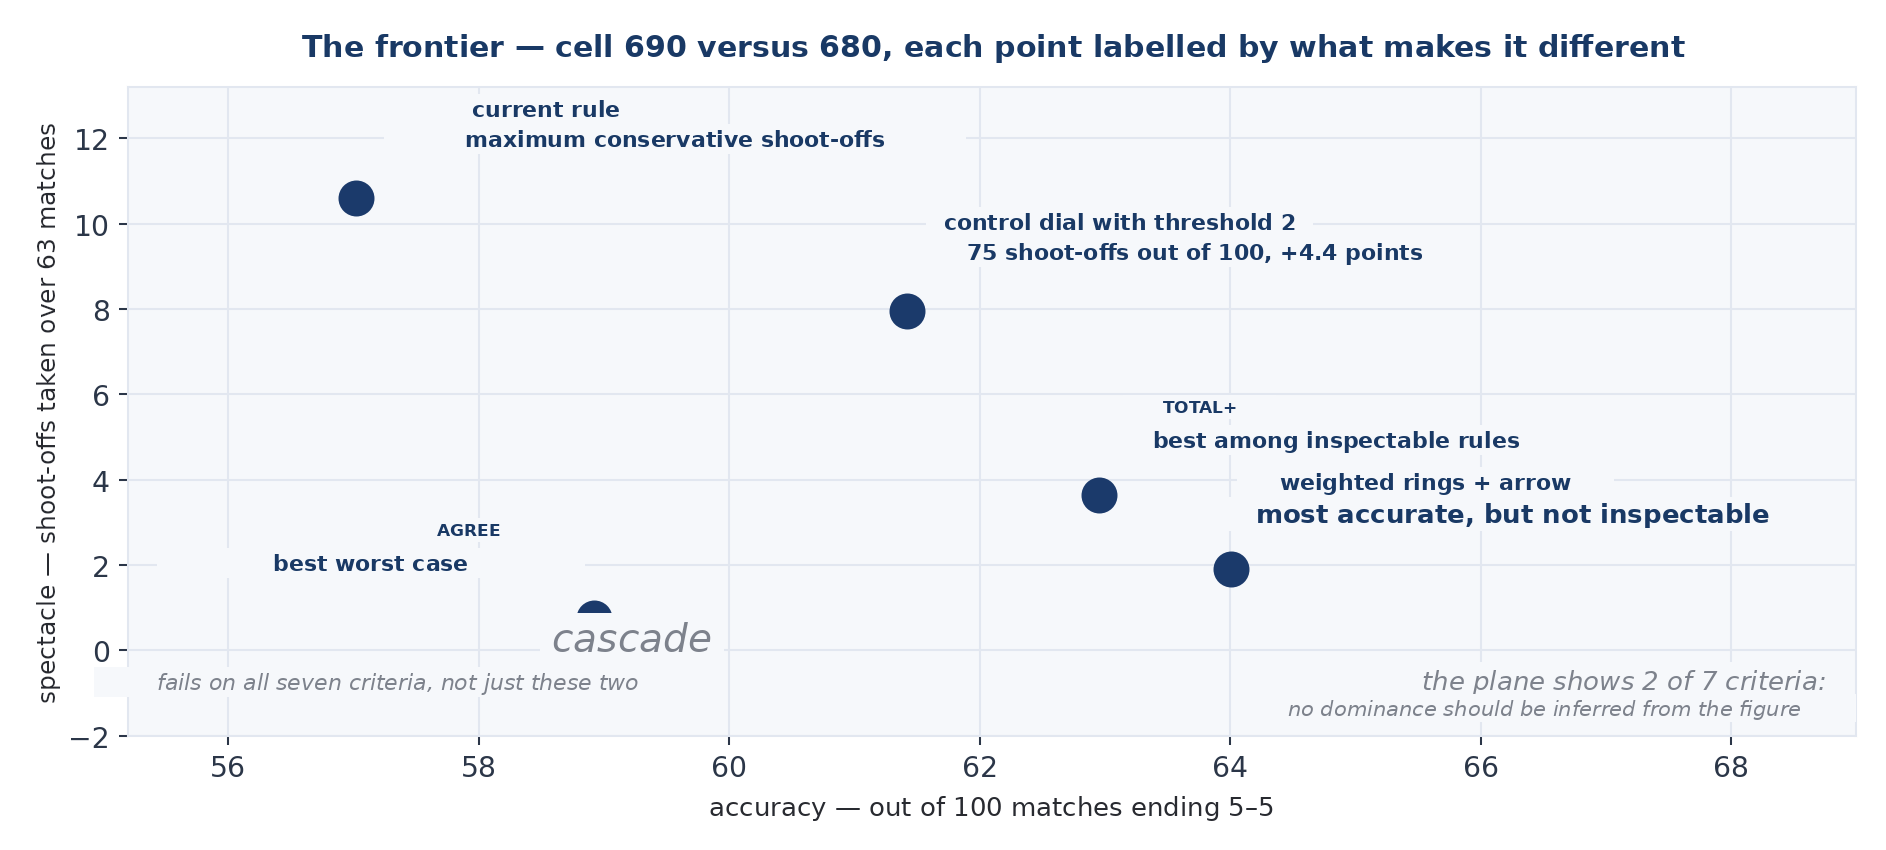
Figure 7. The frontier. Expected accuracy against shoot-offs preserved, pair 690 against 680, population of matches ending five-all. The plane shows two of the seven criteria: the cascade appears here in a reasonable position and is excluded on an axis this figure does not show — robustness — so no dominance should be inferred from the drawing.
23. The bracket matters more than the rule — but by how much
Everything preceding this concerns a single match. A competition, however, is a bracket, and before closing this part I set the tie rule beside the things it really competes with.
The question is put like this: by how much does the frequency with which the title goes to the best archer in the field change when each of the pieces making up a competition is changed? All the quantities that follow are measured on the same machinery, on the same field and in the same units — something that in the debate on these topics almost never happens, because these interventions live in separate discussions and nobody puts them on the same footing.
Three words on terminology are needed first, and they will recur throughout Part Two. The seeding is the order in which archers enter the bracket and serves to establish who meets whom: the first faces the sixty-fourth, the second the sixty-third, and so on; today it comes from the qualification round rankings. Reseeding is the variant in which, instead of fixing the whole bracket at the start, the pairings among the survivors are recomposed after each round, so that the highest-ranked always faces the lowest remaining. The season ranking, finally, is an estimate of each archer’s accuracy computed from the scores of every competition he has shot in the preceding months: building it is the task of Part Three, and here it matters only as an alternative source of the seeding.
| What is changed | Range between the worst and the best option |
|---|---|
| The tie rule, from a draw to the best obtainable within the rulebook | 1.1 points |
| — and from the rule in force to that best | 0.4 points |
| — and as far as reading distances, which the rulebook does not provide for | 1.5 points |
| The structure of the bracket, among the five compared in that run | 1.7 points |
| Where the seeding comes from, from the qualification to the season ranking | 2.7 points |
(Probability that the title goes to the best archer in the field, in percentage points. Compact 64-archer field between 690 and 665, forty thousand tournaments for the first three rows and twelve thousand for the other two; the last two measured with the seeding a qualification round actually produces, and taken from the runs in the replication archive — not from the table of seven structures in chapter 28, which compares a different set. Chapter 40 reports the first column in full.)
Read in terms of competitions, the table says this. Today the title goes to the best archer in the field once every ten competitions. Changing the tie rule from a draw to the best possible takes this to once every nine: one more title every ninety competitions. The choice a federation actually has, moving from the rule in force to the best of those that can be applied, is worth four tenths of a point — one more title every two hundred and fifty competitions.
If arrow distances could be measured the range would rise to one and a half, which puts the tie rule among the other two items rather than at the bottom; but it requires instrumentation that does not exist today. It is in any case consistent with everything we have seen: the rule acts on only one match in six, and moves it very little.
The structure of the bracket is worth one and a half times the rule, not seven times. And here there is a caveat, because the number changes a great deal depending on what is assumed: if one assumes that the seeding mirrors the true order, the same range widens considerably — among the four structures of chapter 27 the title goes to the best archer in 10.4% of tournaments with protected seeds and in 16.1% with reseeding: nearly six points of range, against the 1.1 of the tie rule. But that assumption is false, and Part Two measures by how much.
The seeding, finally, is the first of the three: changing where it comes from is worth one and a half times the structure and two and a half times the tie rule. It is the result that organises Part Two, and it was not in the plan for this work.
There is then a confirmation arriving by a completely different route, one that does not pass through the seeding. Looking at which configuration gives each tie rule its worst result, one finds that for seven rules out of eight the worst case is not the most hostile model but the most unbalanced field — the one in which the bracket pairs 16 top archers with 48 much weaker ones. It is not the generator that ties the worst case: it is the field.
The bracket therefore matters more than the tie rule, and where the seeding comes from matters more than the bracket. But all three matter little, and the reason is visible once the scale is fixed: what is being moved is a number that starts at one competition in ten and does not reach one in six. On a spread-out field, where the first and the last are seventy points apart instead of twenty-five, it rises to a little over one competition in four and a half — but that is a competition in which the best archer is obvious to the eye, and the measurement matters less.
This is not a criticism of archery. A single-elimination bracket is made that way, and no sport using one can do much better: it is the context within which any discussion of a rule that moves it half a point should be read.
24. What to take away from Part One
The margin exists and it is small. In a 64-archer competition 63 matches are shot, and about ten end tied. A coin would direct five of them correctly; the rule in force five and three quarters; the best possible procedure six and six tenths. Between what is done and what could be done there is less than one archer per competition in play.
There is, however, a better rule, and it fits in one line: the archer with the higher total wins, and if the totals are level too an arrow is shot. It takes 85 per cent of the available margin, costs nothing, is verifiable by eye, and has 3.6 shoot-offs shot per competition instead of 10.6.
It works for a reason that can be read off a table. The shoot-off arrow guesses right 57 times in a hundred whatever happened in the match, because it is fresh data that knows nothing of what preceded it. The total guesses right 61 with one point of margin, 71 with two, 81 with three. One point of margin already beats the arrow, and there is a margin in two cases out of three.
The traditional criterion is worse than a coin at the exact point where it is applied — as long as impacts are distributed as the model assumes; Appendix B shows that only with heavy enough tails does the direction reverse. The ten count, on matches with level totals, points to the wrong archer, because there it does not measure ability but how far the deficit is concentrated on few arrows. And it is consulted only there: in ordinary ties in the qualification rankings, after the Xs have tied. In matches the rulebook in force does not use it at all, because at five-all the arrow is shot, nor for the ties that decide access to the elimination rounds, where a shoot-off is prescribed.
Accuracy and spectacle are not mutually exclusive. The dial at two points keeps eight shoot-offs out of ten and still gains four times in a hundred over the rule in force.
And there is a road that would lead out of this narrow margin, which is to measure distances instead of rings: it takes the ceiling from one and six tenths of an archer to a round two per competition, and requires a precision of 3 millimetres that is not laboratory precision.
25. The competition is a single object
Part One measured the last step of a competition. But a competition does not begin at five-all: it begins with a qualification round in which everyone shoots 72 arrows and is placed in a ranking, continues with a bracket that decides who meets whom on the basis of that ranking, and only then come the six elimination rounds with their matches and their occasional ties.
For weeks I treated these pieces as separate problems, and I was wrong. They are a single object, and the reason is precise: the bracket is built on the seeding, and the seeding comes from an imperfect measurement. The archer who qualifies fourth is not necessarily the fourth best, and a wrong seeding changes who meets whom, and therefore changes everything that comes afterwards. As long as one assumes that the seeding is the true order, every bracket structure looks better than it is — and that is the error this part corrects, changing one number in Part One as well.
The question then becomes a single one: if we wanted to build the best possible competition, what would it look like? And since “best” depends on what one wants, the answer comes in four versions. A precision design, which has the best archer win as often as possible. A spectacle design, which maximises what keeps the crowd engaged without losing accuracy. A balanced design, which improves accuracy without taking anything away from anyone. And a minimal design, for those who do not want to change even that: the identical competition, changing only how the results are read. Chapters 36 to 39 describe them in full, from the first arrow to the last; the chapters before them build the pieces they are made of.
26. How wrong the qualification round gets it
Before everything else, the number on which the whole of Part Two depends.
I simulated sixty thousand qualification rounds over a field of 64 archers of known ability, ranked them by score as a real competition does, and compared the resulting order with the true one.
| Type of field | Arrows | The top qualifier really is the best | The top eight are the best eight | Mean positional error |
|---|---|---|---|---|
| compact | 72 | 14.2% | 0.04% | 8.6 places |
| compact | 144 | 18.9% | 0.3% | 6.5 |
| bimodal | 72 | 24.8% | 1.9 | 6.8 |
| bimodal | 144 | 32.1% | 5.8% | 5.3 |
| spread | 72 | 32.4% | 5.1 | 4.1 |
| spread | 144 | 41.2% | 14.7% | 2.9 |
(64 archers, 60,000 simulated qualifications per row, ties settled by lot: either the archer is first or he is not. The three fields are the declared ones: compact 690–665, spread 695–625, bimodal sixteen athletes at 692–680 plus forty-eight at 655–630.)
The first row is the one that counts, because a top-level field is compact by definition: you get there by selection. And it says three things worth translating one at a time.
The top qualifier really is the best archer in the field 14.2 times in a hundred, a little over once in seven. On a circuit of seven competitions a year, the number one seed is the strongest archer present once, and in the other six it is somebody else.
The top eight really are the best eight four times in ten thousand. Over 120,000 simulated competitions that means fewer than once in two thousand: a judge directing one competition a week for forty years might see it once. Every time protecting the seeds is discussed, then, what is being protected is eight archers who in practice are never the right set.
The mean positional error is 8.6 places. An archer who deserves tenth place finds himself, on average, somewhere between second and nineteenth, and an archer entering the bracket as number fifty may well be worth twentieth, and find himself in the first round against somebody he should never have met.
Why it gets it so wrong
This is not a defect of the qualification round, and it is important to understand that so as not to draw the wrong conclusion from it. It is the same thing Part One had already measured, seen from another angle.
Seventy-two arrows tell two archers ten points apart very well: they manage it 95 times in a hundred, and err once in twenty. But in a compact field — sixty-four archers between 690 and 665 — the distance between two neighbours in the ranking is not ten points. It is four tenths of a point. And at that gap the same 72 arrows identify the better archer 52.9 times in a hundred, which is almost a coin toss.
That is the whole reason the qualification round is off by eight and a half places: it is not being asked to separate distant archers, it is being asked to order sixty-four of them who all lie within twenty-five points. It would be like expecting a kitchen scale to line up sixty-four bags of flour differing by one gram from each other: the scale works perfectly well, it is the question that is too fine for the instrument.
And here is the awkward part: the worst case is also the one that matters most.
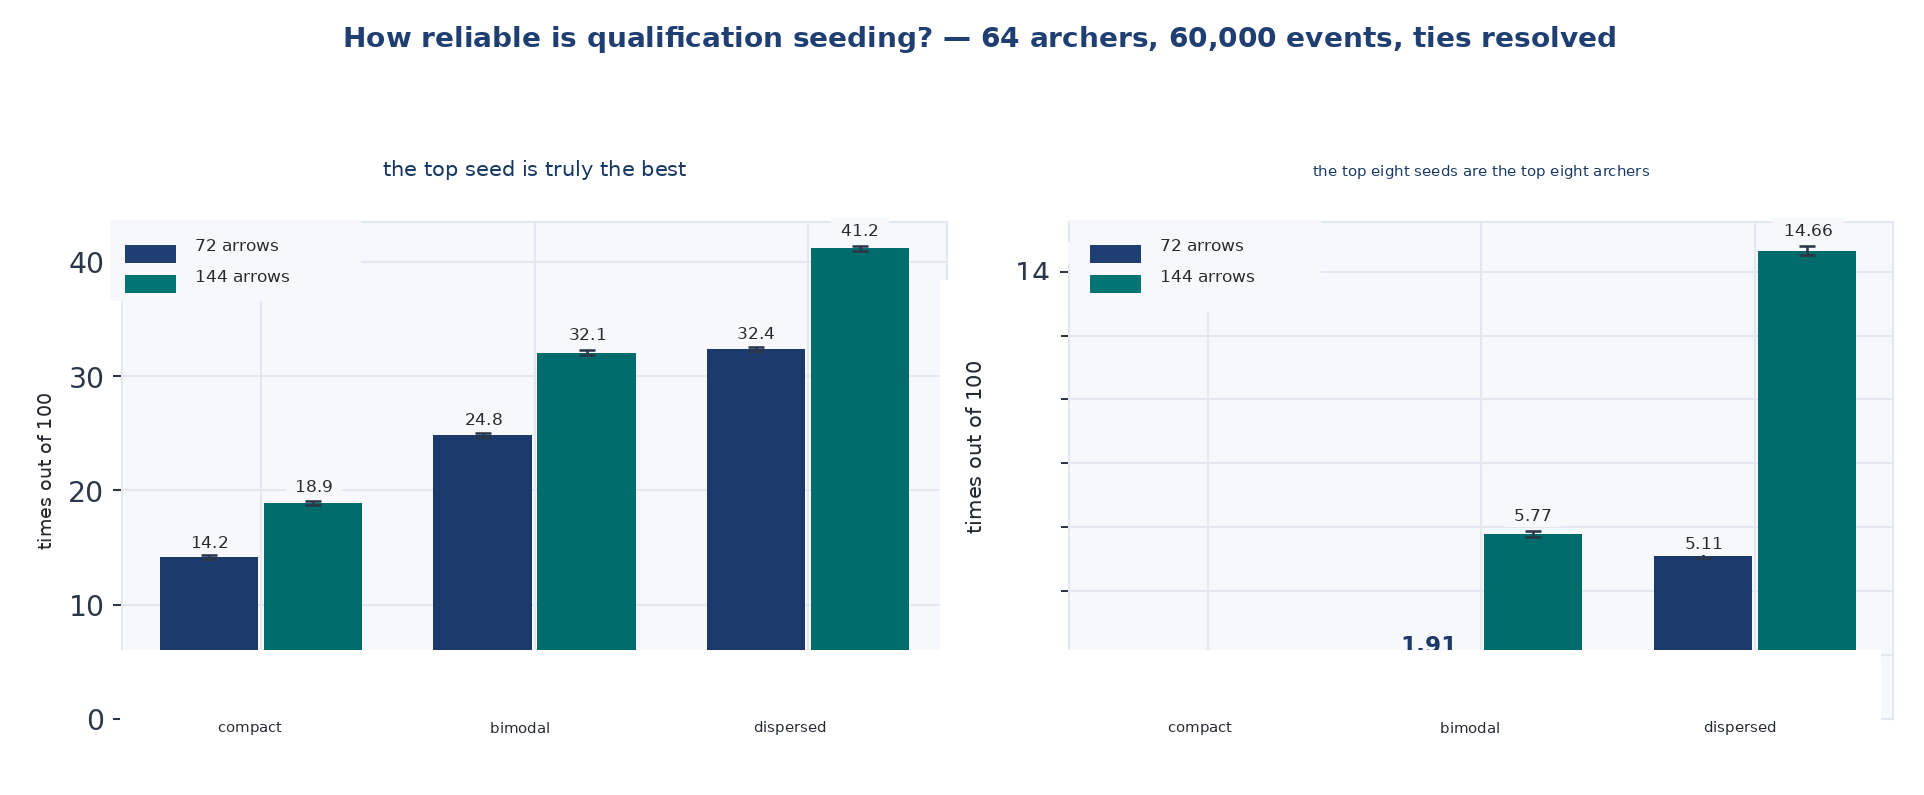
Figure 8 — How reliable the qualification seeding is. Probability that the top qualifier is the best archer and that the top eight are the best eight, for three types of field and two qualification lengths. 64 archers, sixty thousand simulated competitions per cell.
27. The toll of seeding
If the seeding gets it wrong, whoever uses it pays, and pays in proportion to how much use is made of it. I call that loss the toll, and it is the design principle of this whole part.
It is measured by comparing every bracket structure with itself: once assuming the seeding is the true order, once using the one a qualification round actually produces. The difference is the toll: how much that structure loses purely by trusting an imperfect ranking.
| Structure | With true seeding | With real seeding | Toll |
|---|---|---|---|
| Standard bracket | 10.77% | 10.03% | +0.74 ± 0.11 |
| Protected seeds | 10.35% | 9.66% | +0.69 ± 0.11 |
| Quarter-final repechage | 12.46% | 10.83% | +1.63 ± 0.11 |
| Reseeding at every round | 16.11% | 11.29% | +4.82 ± 0.12 |
(Probability that the title goes to the best archer. Compact field, one hundred and fifty thousand tournaments, paired comparison in the strict sense: the same random draw decides the outcome of a given pairing in both columns, so that only the origin of the seeding changes. It is the way to measure a difference with a much smaller error than the same difference between two independent runs would carry: that would bring an error of about 0.12 points, whereas the pairing brings it to 0.11–0.12 on a quantity that is the difference between two levels, each with an error of 0.08–0.09. The right comparison is with the independent difference, not with the levels. Late-round repechage does not appear because it is not among the structures the engine implements; the following chapter measures it alongside the others.)
The picture is not a continuum, but neither is it a dichotomy: it is a staircase with three steps.
The standard bracket and protected seeds pay the same toll, seven tenths of a point each, and the difference between them is smaller than the error of the measurement — there is none. The quarter-final repechage pays more than twice as much, one point six. Reseeding pays four point eight: on its own, more than the other three combined.
Put in terms of titles awarded, over a hundred editions of a championship reseeding hands almost five more of them to the wrong archer than it would if the qualification round told the truth. The standard bracket, in the same situation, gets fewer than one wrong. Reseeding is not a more fragile structure by ill luck: it is more fragile because it consults the ranking at every round instead of once, and every time it consults it, it inherits its error.
Anyone designing a bracket is choosing, without knowing it, how many times to trust a qualification round.
And a consequence follows that narrows the space of solutions: the first-round error cannot be compressed from inside the structure. None of the four falls below seven tenths of a point, and the differences among the first three are not distinguishable. Any bracket with seeds pays that toll, and to reduce it, changing the structure is not enough: the seeding has to be improved.
A note that applies to all the tables that follow
The quantities in this part are simulated rather than exactly computed, and different chapters measure them with independent runs: the same quantity therefore appears with slightly different digits in different tables. These are not values in disagreement — it is the same quantity measured more than once, like weighing yourself two mornings running.
The errors, however, should be read for what they are. The paired differences in the table above carry an error of about a tenth of a point, because the same randomness decides both columns; absolute levels measured by independent runs carry more. Comparing one with the other makes no sense, and in this table the levels do not have a separate error. I have not harmonised them artificially, because their dispersion is itself the information that says how far to believe the third digit: in Part Two two digits are to be read, not three.
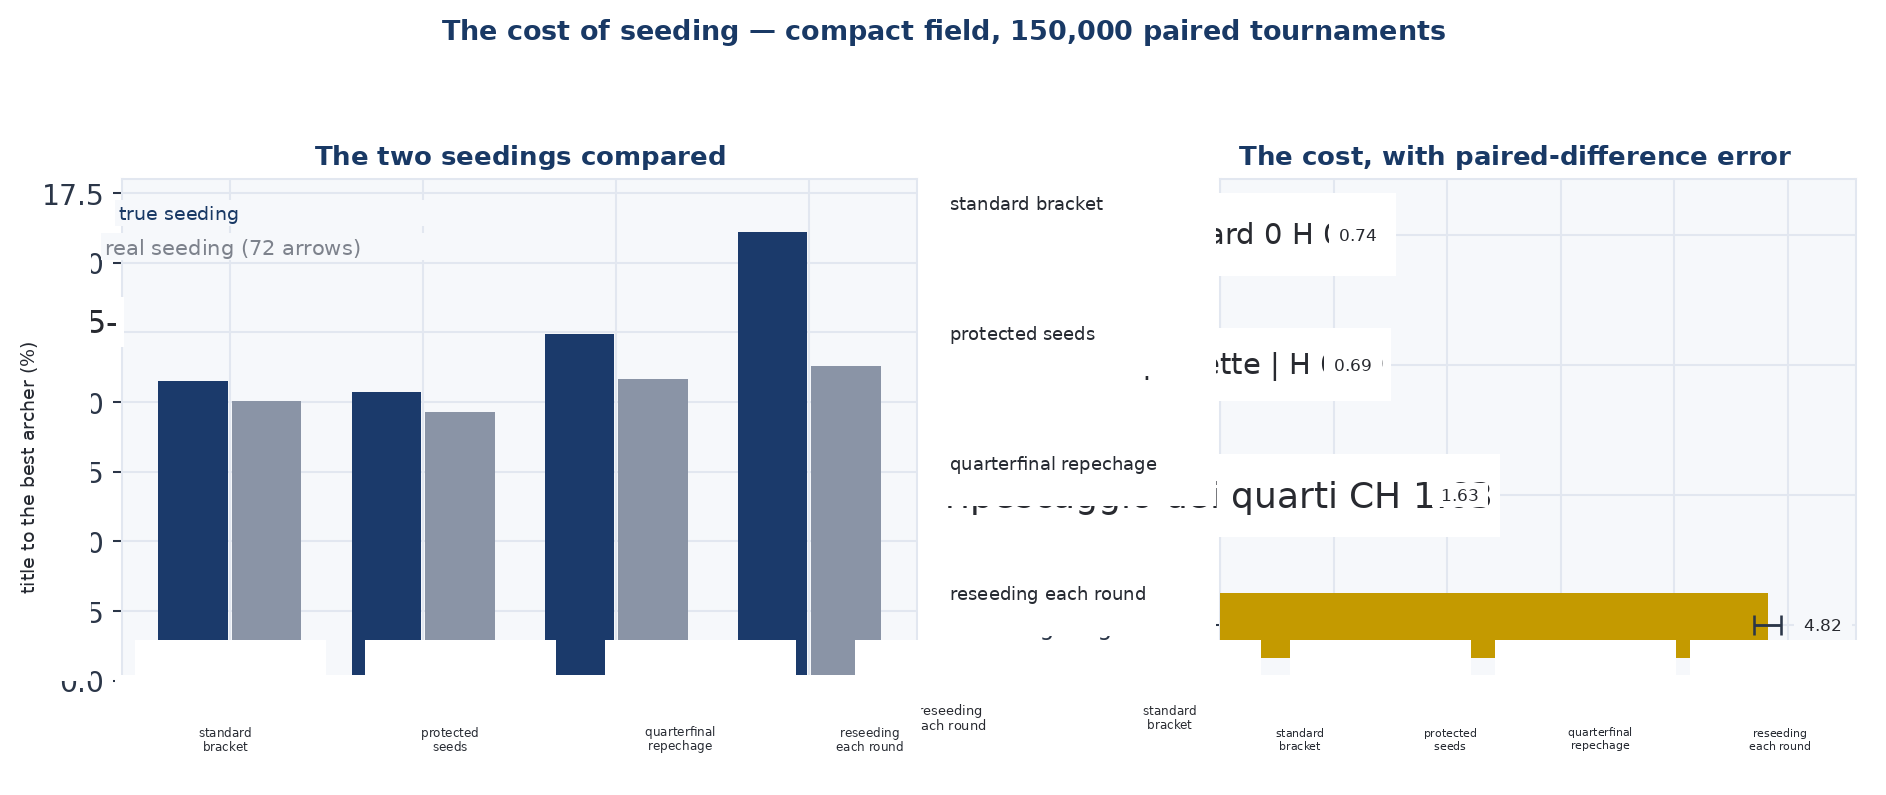
Figure 9. The toll of seeding. Percentage points lost by each structure in going from the true order to the one produced by a 72-arrow qualification round. Compact field, one hundred and fifty thousand tournaments, paired differences with bars at one standard error.
28. Seven ways to build a bracket
Here is the complete set, each structure explained before being measured.
The standard bracket is the one in use: single elimination from 64, with the pairings fixed at the start according to the seeding and the loser out. Sixty-three matches.
Reseeding is the variant in which the bracket is not fixed: after each round the pairings among the survivors are recomposed according to the seeding, so that the highest-ranked always meets the lowest remaining. The idea is to protect the best archers at every step rather than only at the first, and the number of matches does not change.
The quarter-final repechage leaves the standard bracket in place as far as the quarter-finals, then gives a second chance. The four archers eliminated in the quarter-finals play a mini-bracket of three matches — two repechage semi-finals and a final — and whoever comes out of it faces, in an additional play-off, the lowest-seeded of the four quarter-final winners; the winner of that play-off goes to the semi-finals. The tournament thus goes from 63 to 67 matches.
Every word of that description matters, and here is why. The same structure told in a slightly different way becomes four distinct competitions, with results ranging from 7.3 to 11.2 per cent: saying that the repechage winner faces the lowest-seeded rather than the highest-seeded shifts the result by as much as seven bad measurements could shift it — a distance chance never produces. The version described here is the one measured, and it is also the only one a federation would write; the repechage winner arrives from a defeat, and letting him in without playing would take from a winning quarter-finalist a place earned on the field.
The late-round repechage is a different structure, not a wider repechage, and the difference matters. The main bracket remains the standard one, but archers losing from the round of 16 onwards drop into a secondary bracket where they continue to play single elimination; an archer losing in the first round is out immediately. Fifteen archers therefore drop down — eight from the round of 16, four from the quarter-finals, two from the semi-finals and the loser of the final — and the secondary bracket, ordered by qualification seeding, gives the bye to the highest-seeded. The winner of the secondary bracket plays the final against the winner of the main bracket, who arrives unbeaten and can lose it. 78 matches in all.
Here is how this entered the list, because nobody designed it: it was born from a mistake. It was meant to be a double elimination, and owing to a defect in the code it collected only the archers who lose from the round of 16 onwards (fifteen archers) instead of all of them. The error was discovered because the number said something impossible — that losing the first match gave zero probability of winning the title — and the structure was kept because it does measure a real competition, and one different from the other five.
The same family of functions then produced a second defect of the same nature: the secondary bracket received fifteen archers, and the function that played it, written for a number of participants that is a power of two, discarded one of them without letting him shoot an arrow. That function now refuses numbers it cannot handle, byes have to be declared, and the number of matches in each structure is counted by running it rather than written in by hand. The two lessons are the same one: a bracket that accepts any field conceals its own defects instead of flagging them.
Protected seeds keep the top eight qualifiers apart from each other until the quarter-finals, with the pairings among the rest drawn by lot.
Double elimination, finally, sends the loser into a secondary bracket instead of eliminating him. In the form simulated here, however, the final is a single match between the winner of the main bracket, still unbeaten, and the winner of the secondary: an archer coming from the main bracket can therefore go out at the first defeat, and for that reason I call it double elimination with a single final. All the losers drop into the secondary bracket, including the thirty-two from the first round, and the two brackets proceed in parallel. One hundred and twenty-six matches, twice as many: two days of competition instead of one.
Double elimination in the strict sense is the same structure with one difference, and it lies entirely in the final. In the previous version the winner of the main bracket arrives unbeaten and can go out at the first defeat, which is not a double elimination: here, if the winner of the secondary bracket wins the first final, the two have one defeat each and a second is played. That makes 126 matches, or 127 when the second final is played — which happens in 49.7 per cent of tournaments, so the expected length is 126.50. It is the only one of the seven structures without a fixed length, and for that reason its cost is stated as a range rather than a count.
| Structure | Title to the best | Matches played |
|---|---|---|
| Reseeding | 11.56% | 63 |
| Quarter-final repechage | 11.06% | 67 |
| Standard bracket | 10.26% | 63 |
| Late-round repechage | 11.79% | 78 |
| Protected seeds | 9.72% | 63 |
| Double elimination with a single final | 10.90% | 126 |
| Double elimination in the strict sense | 11.28% | 126–127 |
(Compact field, real 72-arrow seeding, 25,000 tournaments from the same paired run, with the seed declared in the values file. The standard error of each level is about two tenths of a point, so that of the difference between two rows is about three: differences below half a point are to be read as indistinguishable. All seven rows come from the same run — same fields, same qualifications, same match randomness — and the repeated matches are fresh realisations, as a repechage structure requires. The matches column is an exact count of the structure, measured separately with different seeds and 2,000 repetitions.)
The two structures at the top (late-round repechage 11.79 and reseeding 11.56) do not separate from each other, and they stand more than a point above the standard bracket. Double elimination with a single final sits lower, at 10.90, despite playing twice as many matches.
What a standard error is, and why nothing can be read without one
It recurs throughout this part, so I explain it once.
These numbers come from simulations, and a simulation gives a slightly different result every time, like counting how many heads come up in a thousand coin tosses: about five hundred, but never exactly five hundred. The standard error measures how much that “about” fluctuates.
The rule of thumb is simple. Two values less than two standard errors apart could perfectly well be the same number measured twice; at three or more the difference is real. In this table the standard error of each level is about two tenths, and that of the difference between two structures about three: two structures half a point apart are to be considered level, and two that are one and a half apart genuinely different.
And here is the reversal this part was after. With the true seeding, reseeding pulled four points clear of everything; with the real one the repechage catches it, paying a quarter of its toll.
The two structures arrive at the same point by opposite routes, and that is what one takes away from this chapter. Reseeding corrects the errors of the seeding by reordering, so it inherits the seeding’s noise five times instead of once, and it does so without spending an extra match. The repechage corrects them by having more matches played, and a match does not consult the qualification round: it measures directly. The two roads lead to the same result, but one costs sixty-three matches and the other between sixty-seven and seventy-eight, depending on how wide the repechage is.
One would then expect the repechage, being more robust, to overtake reseeding when the qualification round gets worse. It does not, and I checked: at 36 arrows reseeding’s advantage is two tenths, at 72 six, at 144 two. The three values each carry an error of a little over two tenths, so the only thing the data support is that the advantage does not close as the qualification round deteriorates — reseeding starts from so much higher that it is not caught. That it widens as the qualification improves is plausible and consistent with the mechanism, but on these numbers it is not demonstrated.
Across the three types of field, moreover, the sign never changes, but the magnitude varies by a factor of eight.
| Field | Reseeding | Repechage | Difference |
|---|---|---|---|
| compact | 10.9% | 10.9% | −0.05 ± 0.17 |
| spread | 24.4% | 24.5% | −0.16 ± 0.21 |
| bimodal | 18.3% | 18.9% | −0.57 ± 0.18 |
(Real 72-arrow seeding, one hundred and fifty thousand tournaments from the same run, with the seed declared in the values file, paired comparison.)
The two structures almost never separate, and where they do it is the repechage that comes out ahead. On a compact field and on a spread field the difference is within the noise. On a bimodal field the repechage wins by a little over half a point with an error of two tenths, which is a difference chance does not explain.
The interpretation is not the one you would expect. Reseeding puts the highest-seeded archer in the easiest part of the bracket; the repechage gives a second chance to an archer eliminated by an unlucky pairing. On a field where half the archers are indistinguishable from each other, the second thing matters more than the first.
And on a top-level field, which is compact, the choice between the two is settled by the repechage’s four extra matches and not by accuracy. Precisely where the title matters most, the technical criterion falls silent and logistics decides.
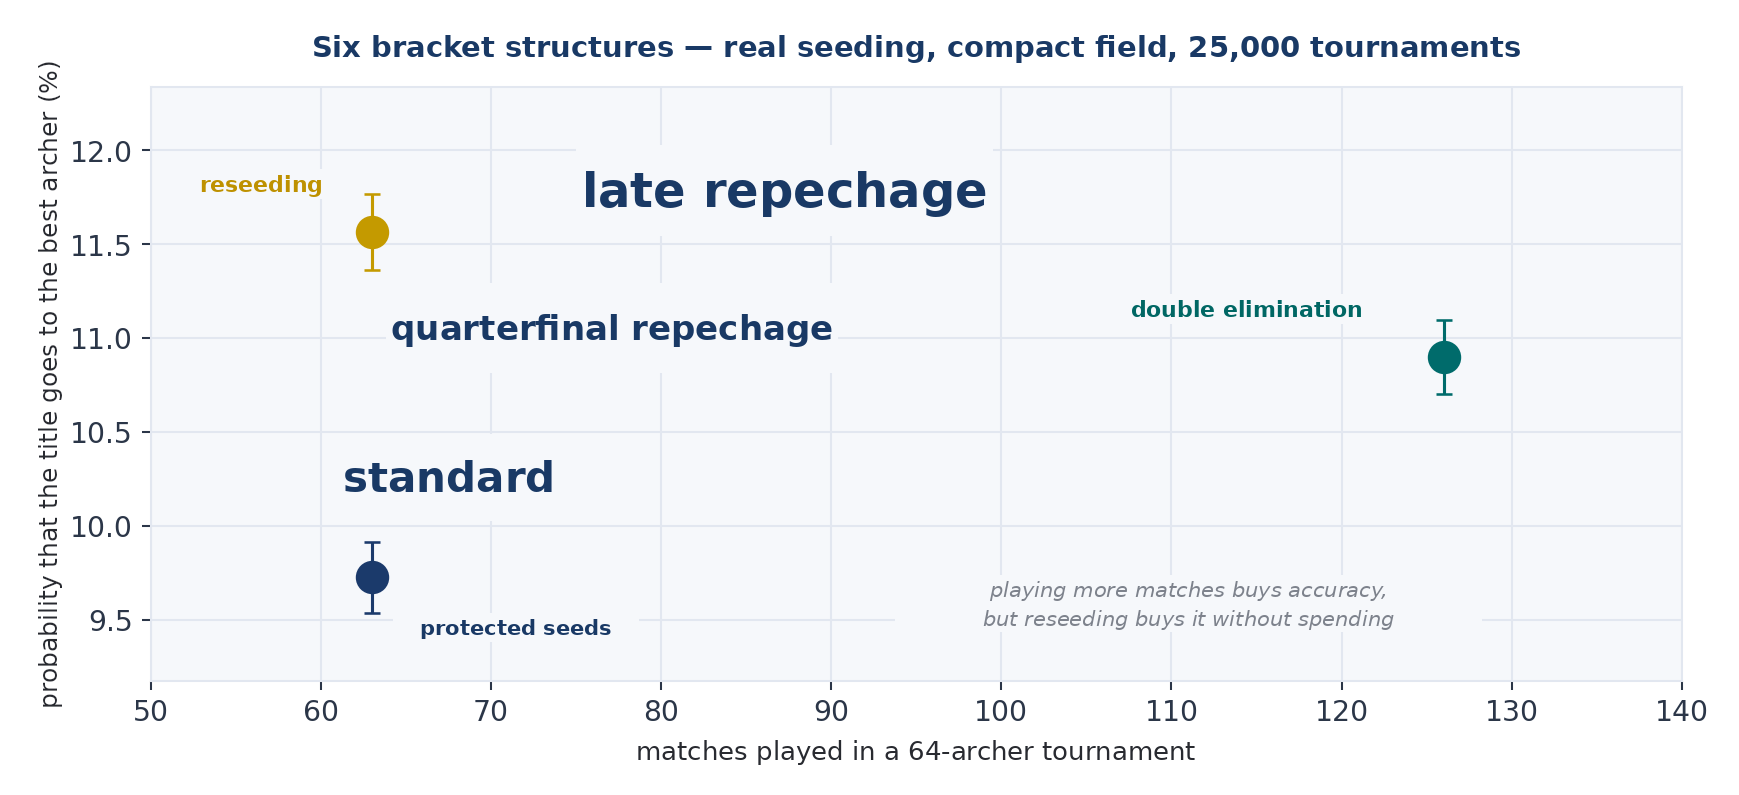
Figure 10. The bracket structures. Probability that the title goes to the best archer against number of matches played. Compact field, real 72-arrow seeding, twenty-five thousand tournaments from the same run, with the seed declared in the values file.
29. Double elimination: right in theory
It deserves a chapter of its own, because it is the structure everybody proposes when they complain about single elimination, and because the verdict is twofold.
On one side it is strategically sound. The legitimate worry is that an archer might gain an advantage by losing deliberately, so as to end up in an easier secondary bracket. It does not happen, and the reckoning is clear-cut: an archer who wins his first match has ahead of him a competition in which he wins about twelve tournaments in a hundred; if he loses it on purpose in order to drop into the secondary bracket, he wins a little over one. Losing deliberately therefore costs 10.8 points of probability on the title, a difference twenty times larger than the error of the measurement. No incentive, and no ambiguity.
On the other side it costs twice as much. With 64 archers and all the losers in the secondary bracket, 126 matches are played instead of 63 — two days instead of one — and the result is 10.90 per cent.
Why does a second chance help, and why does it help less than it costs? A second route is not a second measurement of the same thing: it is one more measurement, but of something easier. The secondary bracket has many matches played among weak archers, and its winner reaches the final having beaten mediocre opponents; so the fact that he got there says less than the same route through the main bracket would say. It remains, however, a genuine measurement, made on the field rather than on the qualification round, and that is what explains the gain: information is added where the seeding had little. The price is that buying a point and a half of it takes sixty-three extra matches, whereas reseeding buys just as much without spending any.
The real comparison, though, is not with the standard bracket, which sits at 10.26, but with reseeding: 11.56 per cent with sixty-three matches — a better result for half the competition time. That is what makes double elimination with a single final hard to propose: it does not even reach the same place, and it asks for an extra day of competition.
It can be objected that the fault lies with the single final and not with the structure, and that objection is measurable: it is enough to make the second defeat really count, requiring the winner of the secondary bracket to beat the champion of the main bracket twice. Measured on the same run, that variant gives 11.28 per cent against the 10.90 of the single final, and costs 126 matches, or 127 depending on whether the second final is played. The gain is there and it is four tenths, so the single final was costing something; but it stays below reseeding, which gives 11.56 with half the matches. The objection is well founded and it does not change the conclusion: double elimination, in both forms, spends twice the competition time to arrive lower down.
Where this number comes from matters, because the first edition accompanied it with a caution that has since expired. That caution said the measurement needed redoing, because an earlier run reused the randomness of the first meeting: the winner of the first encounter between two archers was forced to win the rematch as well, and for a structure in which the rematch is the mechanism itself, that defect is decisive.
The current engine no longer has that defect. The randomness is tied to the pairing and to the number of the encounter, so every rematch is a fresh realisation, and the function that decides a match refuses to proceed if a pairing were to meet more times than realisations have been drawn, instead of reusing one. The 10.90 reported here comes from that engine, and it is reproduced by the frozen producer: the first edition’s caution is to be removed and not repeated.
What does remain true is the result on incentives, computed separately: losing the first match deliberately costs 10.8 points of probability on the title, twenty times the error of the measurement.
It is a rare case in which there is no trade-off to discuss, because double elimination with a single final costs twice as much and yields less than reseeding. In a work that repeats at every chapter that every choice is an exchange, a case in which it is not deserves an explicit line.
A technical note for anyone wanting to adopt it anyway: the secondary bracket should be paired by order of elimination and not by seeding, because it has already lost the best archers and there is no order left to get right.
30. Repechage has a dose
Lining up the three degrees of repechage reveals something nobody had predicted.
| Width of the repechage | Title to the best | Matches |
|---|---|---|
| none (standard bracket) | 10.3% | 63 |
| quarter-finals only | 11.1% | 67 |
| from the round of 16 onwards — fifteen archers | 11.8% | 78 |
| everyone (double elimination) | 10.9% | 126 |
(Compact field, real 72-arrow seeding, one hundred and fifty thousand tournaments from the same run, with the seed declared in the values file; the double elimination and the late-round repechage are measured separately, with dedicated runs.)
Opened to the quarter-finals alone, the repechage buys eight tenths of a point over the standard bracket. Opened from the round of 16 onwards (the fifteen archers who lose between the round of 16 and the final) it buys one and a half. With double elimination and a single final, only six tenths, while spending twice the matches.
The curve rises and then falls: the maximum is not at the extremes but in the middle, in the structure that gives a second chance from the round of 16. And the reason lies in the final.
Every extra match is one more measurement, and a measurement does not consult the qualification round: it replaces it. That is why the late-round repechage beats the quarter-finals-only version. But double elimination puts the champion of the main bracket, arriving unbeaten after six encounters, in a position to stake everything on a single match against someone coming out of a bracket of losers. That single final throws away the information gathered along the route, and it throws away more than the additional matches produce.
So it is not true that spending more matches always buys accuracy. It is true that it buys accuracy up to the point at which the structure starts discarding what it has measured.
Here is how this structure entered the set, because nobody had designed it. It emerged from an implementation defect — a repechage that was meant to be a double elimination and collected only the archers who lose from the round of 16 onwards — and it turned out to be a real structure, coherent, and informative precisely because it lies in the middle. A design space does not explore itself: I had not thought of a halfway repechage until an error built one.
31. Where to take the seeding from
If the first-round toll cannot be compressed from inside the structure, the only way to reduce it is to improve the seeding. There are three routes, and their prices are very different. Doubling the qualification round to 144 arrows, which costs half a day of competition. Using the season ranking instead of the score of the day, which costs nothing because those data were already shot at competitions in the preceding months. Or doing nothing, which is the current option.
Before measuring them, though, I have to say precisely what this season ranking is, because “ranking” is a word covering at least four different things, and it matters which one you pick.
It is not the circuit points table, the one that at every competition ranks the archers who took part and awards 25 points to the first, 20 to the second, 16 to the third and so on down to one for the fifteenth, zero for the rest and nothing for the absent. It is not the sum of qualification scores, and it is not their mean either. It is the accuracy estimate produced by the procedure of Part Three, applied to the qualification round scores of previous competitions: those same scores, corrected for the difficulty of each competition and then shrunk towards the group mean in proportion to how many competitions the athlete has shot. Anyone wanting the detail will find it in chapter 46, where the procedure is set out step by step, and in chapter 47, where it is worked through on an example.
The distinction matters, and it can be measured. Over 800 simulated seasons with 64 archers, 10 competitions and 6 appearances each, the four methods order the field with this fidelity to the true order.
| What the ranking is built on | Agreement with the true order |
|---|---|
| Accuracy estimate (procedure of chapter 46) | 0.961 |
| Points table by placing | 0.901 |
| Mean of the qualification scores | 0.906 |
| Sum of the qualification scores | 0.906 |
(64 archers between 690 and 665, 10 competitions of 72 arrows, 6 appearances each drawn by lot, normal competition effect with a standard deviation of 11 points, 800 seasons. The agreement is the rank correlation with the true order of ability. The competition effect is the parameter that decides these levels, and it is declared rather than measured: the differences between rows survive reparameterisation, the absolute levels do not.)
The agreement reads like this: it is 1 if the ranking puts the archers in exactly the true order, and 0 if it puts them in an order having nothing to do with ability. All four rows sit very high, so the question is not whether they work but how much the differences among them matter — and five hundredths of agreement, as the next table will show, are worth about one point of probability on the title.
Mean and sum coincide, because when the number of appearances is the same they produce the same order, and they sit five hundredths below the procedure of chapter 46. The points table sits nearly two hundredths below the others: it normalises by competition, so it accounts better for the conditions of the day, but it loses information because it compresses to zero every placing beyond the fifteenth — an archer who finished twentieth and one who finished sixtieth count the same, and they are not the same.
In the rest of this part, “ranking” always and only means the first row of that table.
| Origin of the seeding | Agreement with the true order | Standard bracket | With reseeding |
|---|---|---|---|
| Qualification, 72 arrows | 0.813 | 9.7% | 11.1% |
| Qualification, 144 arrows | 0.896 | 10.2% | 12.2% |
| Ranking over 5 competitions | 0.953 | 10.2% | 12.7% |
| Ranking over 10 competitions | 0.976 | 10.7% | 13.5% |
| Ranking over 20 competitions | 0.988 | 10.4 | 14.0% |
(Compact field, twelve thousand tournaments, this chapter’s own run. The agreement is the correlation between the seeding order and the true one, and it comes from an earlier run: it is not produced by this experiment and is to be read as a qualitative reference. The rankings are produced by the procedure of Part Three, not by an approximate model. This table serves to compare the origins of the seeding and the two bracket structures with each other: its levels are not to be read as the measurement of the balanced design, which comes from the single run of chapter 40 and is 13.7 per cent.)
Three readings, and all three are recommendations.
The first. With reseeding, a ranking built on five competitions beats a 144-arrow qualification round, a qualification twice as long as today’s: 12.7 against 12.2 per cent. It uses data that have already been shot, costs not a single arrow, costs not an hour, and requires no change to the competition schedule. All it requires is a decision that the seeding should come from there.
The second, and it is the most important. On a fixed bracket, a better seeding is worth almost nothing. Going from the short qualification to the 20-competition ranking — from an agreement with the true order of 0.81 to one of 0.99, which is near perfection — the standard bracket goes from 9.7 to 10.4 per cent, which within the error of the measurement means gaining nothing. With reseeding those identical data take it from 11.1 to 14.0.
Put in terms of competitions: buying the best possible ranking and leaving the bracket as it is, the title still goes to the best archer once every ten competitions. Buying it and changing the bracket too, it goes there once every seven. The better ranking, on its own, is an expense that does not show.
Reseeding is therefore not necessarily the most accurate structure (the previous chapter shows that the repechage is level with it or above), but it is the only one that converts a better seeding into accuracy, and that is why it enters the balanced design.
The third. The two interventions do not add up in any simple way, and I can now say by how much. Measured on the same run, the doubled qualification on its own is worth half a point and reseeding on its own one point four; applied together they are worth two and a half, against the one point nine they would give by adding. The excess is six tenths with an error of five: the sign says the pair yields more than the sum, but the measurement does not separate it from zero, and the honest conclusion is that with these data it cannot be decided either way.
What does follow is the practical order of operations, which no table of separate comparisons could have shown: change the structure first, which costs one line of the rulebook, and only afterwards improve the seeding, which costs arrows and hours.
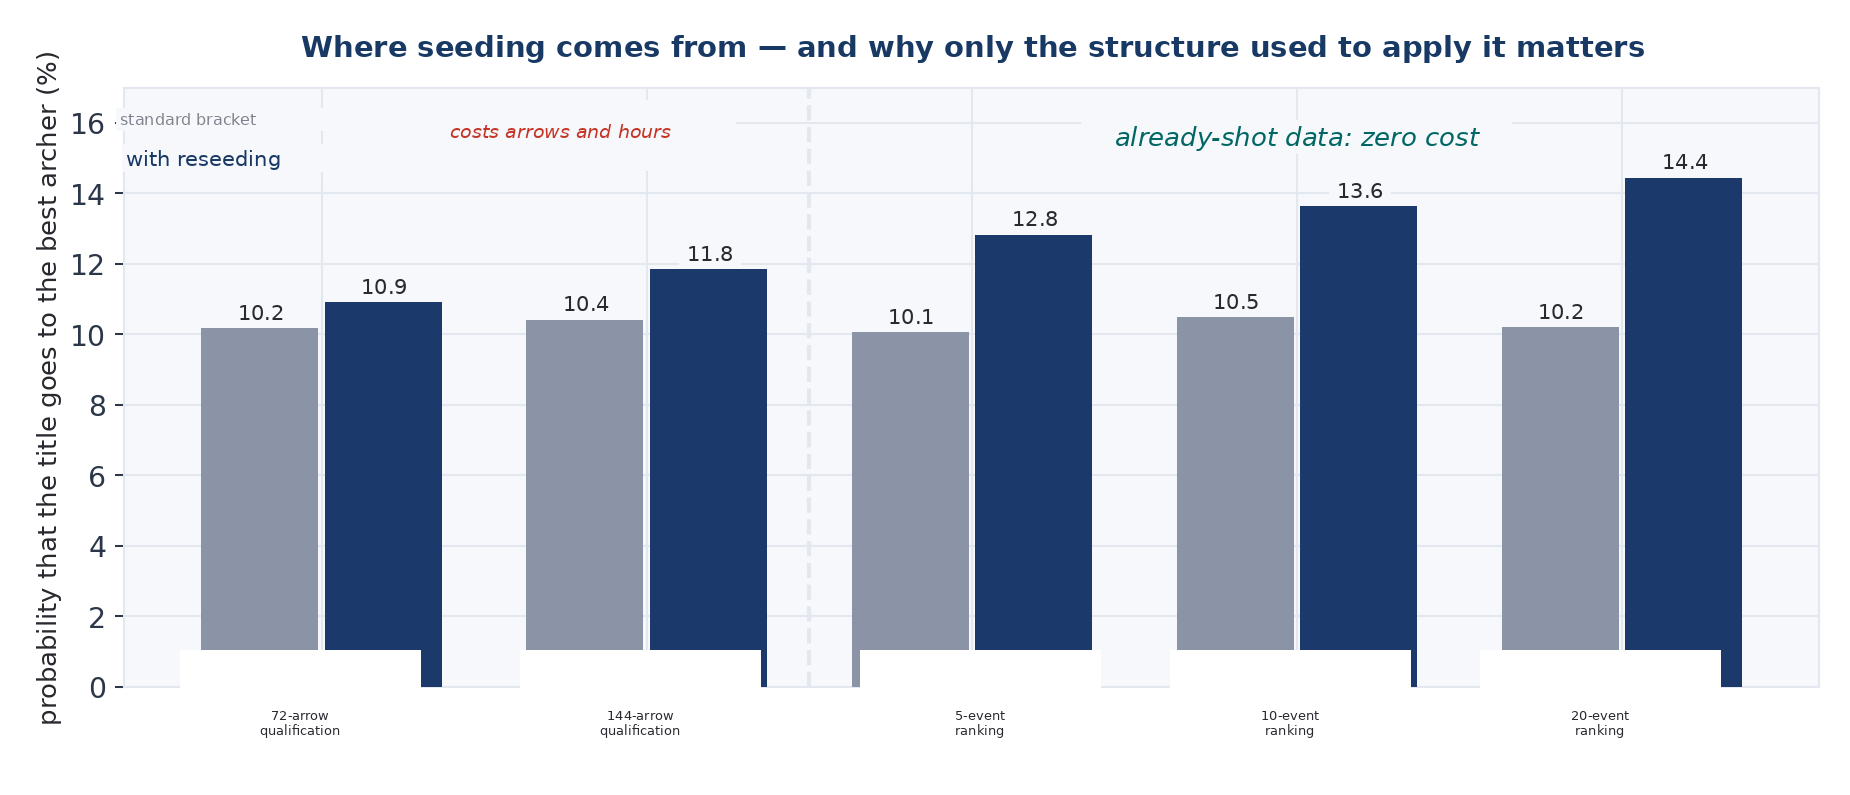
Figure 11. Where the seeding comes from. Probability that the title goes to the best archer for five origins of the seeding and two bracket structures. Compact field, twelve thousand tournaments from this chapter’s dedicated run. The first two columns cost arrows and hours; the other three use data already available.
32. Five ways to shoot 15 arrows
A match is shot with 15 arrows each, and the rulebook establishes how they are to be grouped: 5 sets of three, two points to the winner of the set, first to six. But that grouping is one choice among many possible ones, and the question of this chapter is whether it is the right choice or whether, by changing the way the same 15 arrows are distributed, the better archer could be made to win more often.
I tested five. The first is the current one. The second cuts the sets to the minimum: 15 sets of a single arrow, each won by whoever places that single shot better, and the match won by the first to sixteen points. The third does the opposite: 3 sets of five arrows, first to four.
The fourth and the fifth are the same idea with two different calibrations, and they are the ones I had backed. Sets of three arrows are played as today, but from the fourth set onwards the match closes as soon as one of the two leads by at least two set points; if that does not happen, play continues to a cap (seven sets in the first calibration, nine in the second) and there the leader wins, or, if the score is level, the tie-break rule applies. The idea is that the duration should adapt to the uncertainty: two evenly matched archers shoot for longer, an unbalanced match ends early. It seemed to me the most sensible thing of all.
| Format | Gap of 6 | Gap of 11 | Gap of 25 | Arrows per match |
|---|---|---|---|---|
| current, 5 sets of 3 | 67.99 | 79.40 | 95.29 | 13.5% |
| short sets, 15 of 1 | 68.23 | 79.71 | 95.45 | 13.9 |
| long sets, 3 of 5 | 67.97 | 79.37 | 95.26 | 13.5% |
| variable, cap 7 | 67.11 | 78.04 | 94.06 | 12.9 |
| variable, cap 9 | 67.13 | 78.06 | 94.06 | 13.0 |
(Out of a hundred matches, anchor level 700, exact calculation. The tie on set points is settled with TOTAL+ in every row, with the concordance computed on the population of matches that each format sends to a tie and not on that of the format in force — the rule has to be the same for all, otherwise formats and rules would be compared together — and with the shoot-off arrow in its place every row falls by about a point without the distances between rows changing. The last column is computed at a 6-point gap and does not hold for the other two: the arrows consumed fall as the gap grows, because unbalanced matches end sooner — at 11 points the current format consumes 13.2 and the variable one 12.8.)
The numbers say that among the five there is almost no difference. Between two archers 11 points apart the current format identifies the better archer 79.4 times in a hundred; the best of the five, which is the single-arrow sets, reaches 79.7. Three tenths of difference per hundred matches, which in a competition of 63 means changing the winner of a fifth of a match: you would have to watch five whole competitions for a single archer to end up on the other side of the bracket. Nobody would notice it over a season.
The variable-length format, however, does not merely fail to gain: it loses. At an 11-point gap it identifies the better archer 78.0 times in a hundred against the current format’s 79.4, and in exchange it saves four tenths of an arrow per match. One point four of accuracy is given up to save less than half an arrow per match, and it is a trade nobody would accept.
But the reason for discarding it is a different one, and it is far more clear-cut. That format promised to adapt duration to uncertainty, and it does not. The cap is reached in 1.7 per cent of matches with the tighter calibration and in 0.15 with the other: in a competition of 63 matches the cap comes into play once with the first calibration, and with the second once every ten competitions, once a season on a circuit. In 99.2 matches out of a hundred with the first calibration, and 99.9 with the second, the variable length does not vary at all: it behaves like a fixed-length format with a decorative cap nobody ever touches.
Pause on this, because it is the kind of thing the accuracy numbers do not show. Had I evaluated the five formats only on the axis I was interested in, I would have discarded the variable length by saying it costs a point and a half — a debatable objection, to which one can reply that the saving in arrows is worth something. Looking instead at how often the cap comes into play, one discovers that the format does not do the thing it was proposed for, and that is not an objection: it is an observation that closes the question.
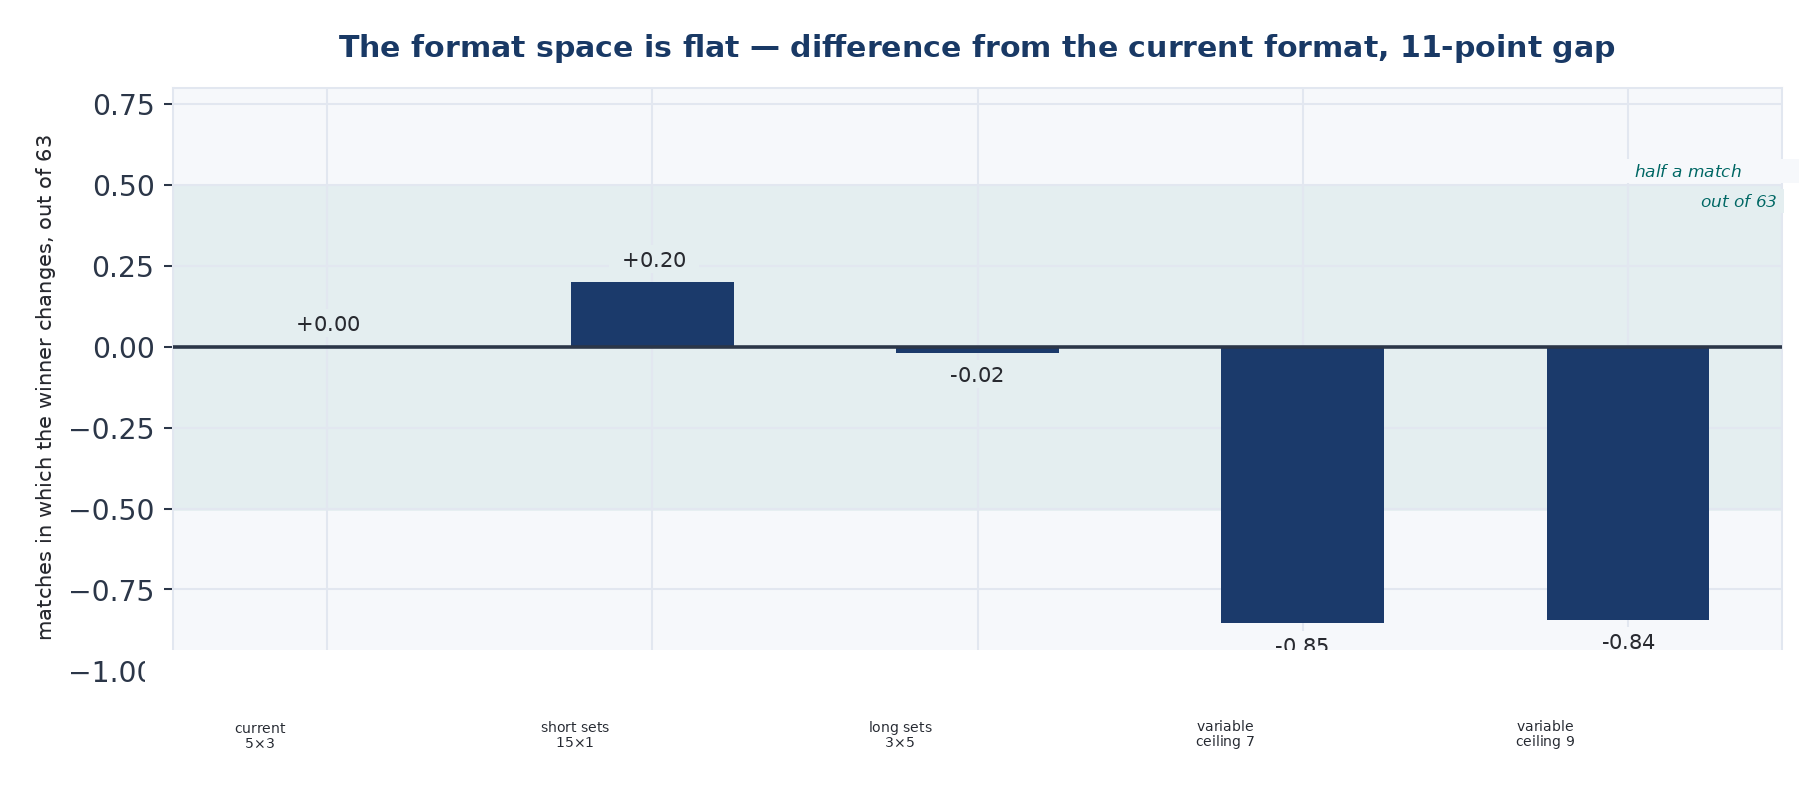
Figure 12. The space of formats is flat. Difference from the current format in matches whose winner changes, over a 63-match tournament. Gap of 11 points, anchor level 700. The band indicates half a match.
An account left open with Part One
There is, finally, a note that closes a question left behind, and it concerns the set format as such — what in international parlance is called the set system. The question is whether that structure, in itself, costs accuracy compared with simply adding up the arrows.
The answer is that it costs about one point per hundred matches: not ten, not five. But with TOTAL+ as the tie rule that cost almost disappears, and at an eleven-point gap the set system reaches 79.40 against a cumulative format’s 79.31 — it overtakes it.
The cost of the set system is therefore almost all in the tie-break rule and not in the format. With the rule in force you pay a point; with TOTAL+ you pay almost nothing and keep all the advantages of the set structure. It is the strongest argument in favour of the current format to emerge from this whole work, and nobody had formulated it because nobody had ever separated the cost of the format from that of the rule that closes it.
33. What spectacle means, in a form that can be counted
The weak point of every discussion of sporting formats is that spectacle remains implicit: everybody knows what they mean, nobody defines it, and the discussion never converges.
I do not claim to measure spectacle. I propose to measure five of its consequences, declared in advance so that nobody can accuse me of having chosen them after seeing the results. How often the match reaches the last set: how often the decision is not already taken when attention is at its peak. How often the lead changes after the first set. How much uncertainty remains at the start of the last set. How many sets it lasts on average. And how many arrows are shot in all.
| Format | Reaches the last set | Lead changes | Expected sets |
|---|---|---|---|
| long sets, 3 of 5 | 63.6% | 9.3% | 2.64 |
| current, 5 of 3 | 52.5% | 15.1% | 4.40 |
| short sets, 15 of 1 | 34.6% | 17.8% | 13.58 |
| variable, cap 7 | 1.7% | 16.5% | 4.26 |
(Gap of 11 points, anchor level 700, exact calculation.)
The fifth measure does not appear in that table because it is the only one that cannot be read off the scorecard: it is computed from the distribution of possible outcomes, and I report it separately, for the format in force alone, because it says something the others do not.
| Gap between the two archers | The last set is reached | Residual uncertainty at the last set |
|---|---|---|
| 6 points | 59.7% | 1.13 |
| 11 points | 52.5% | 1.07 |
| 17 points | 42.4% | 0.96 |
| 25 points | 29.5% | +0.81 |
(Current format of 5 sets of 3, anchor level 700, exact calculation. The uncertainty is measured in bits: it is 1.58 when the three outcomes — win, draw, loss — are equally probable, and falls to zero when the match is already decided.)
Residual uncertainty is to be read as a fraction of its maximum, and the maximum is 1.58, the value one would have if, on reaching the last set, the three outcomes were equally possible and nothing whatever were known.
Read, then, the row for the eleven-point gap, which is the one this whole part is built on. Between two archers that far apart the match reaches the last set once in two, and when it does the residual uncertainty is 1.07, about two thirds of the maximum. Put so that it can be seen: whoever watches that set has three outcomes in front of him still almost entirely open, and is not watching a formality. This is why the format works as spectacle: not only is the end often reached, but when it is reached it is not a foregone conclusion.
Lead changes almost double between long sets and short ones, from 9.3 to 17.8 per cent, while the accuracy between those same two lies within a third of a point. And the probability of reaching the last set goes from 35 to 64. The choice of format is therefore entirely a choice about spectacle, because on accuracy the formats are indistinguishable: anyone advocating a format on grounds of fairness is arguing along a flat axis.
The two extremes, moreover, have opposite effects on the two measures. Short sets maximise lead changes and minimise the probability of reaching the last set; long sets do exactly the reverse. They are two different ideas of what makes a match interesting — continuous uncertainty against a finish in the balance — and it is a choice that can be made, but it is that choice and not another.
There is then a conclusion that reorders the trade-off priced in Part One: TOTAL+ does not change the spectacle measures. Four of the five are properties of the format and do not touch the tie rule, and the fifth changes by a tenth of an arrow out of thirteen.
The tie rule is therefore not an axis of the format’s spectacle. The spectacle lies in reaching the last set, which happens in one match in two, and in a change of lead in one match in seven. The shoot-off is one further moment at the end of a match whose spectacle has already been consumed elsewhere.
This should not be overstated, because the objection is legitimate: the shoot-off has a value these five measures do not capture, because it is short, it is visible, and it is the moment that ends up in the highlights. The calculation says it is not what keeps the crowd inside the match, not that it is irrelevant to how the sport gets told as a story.
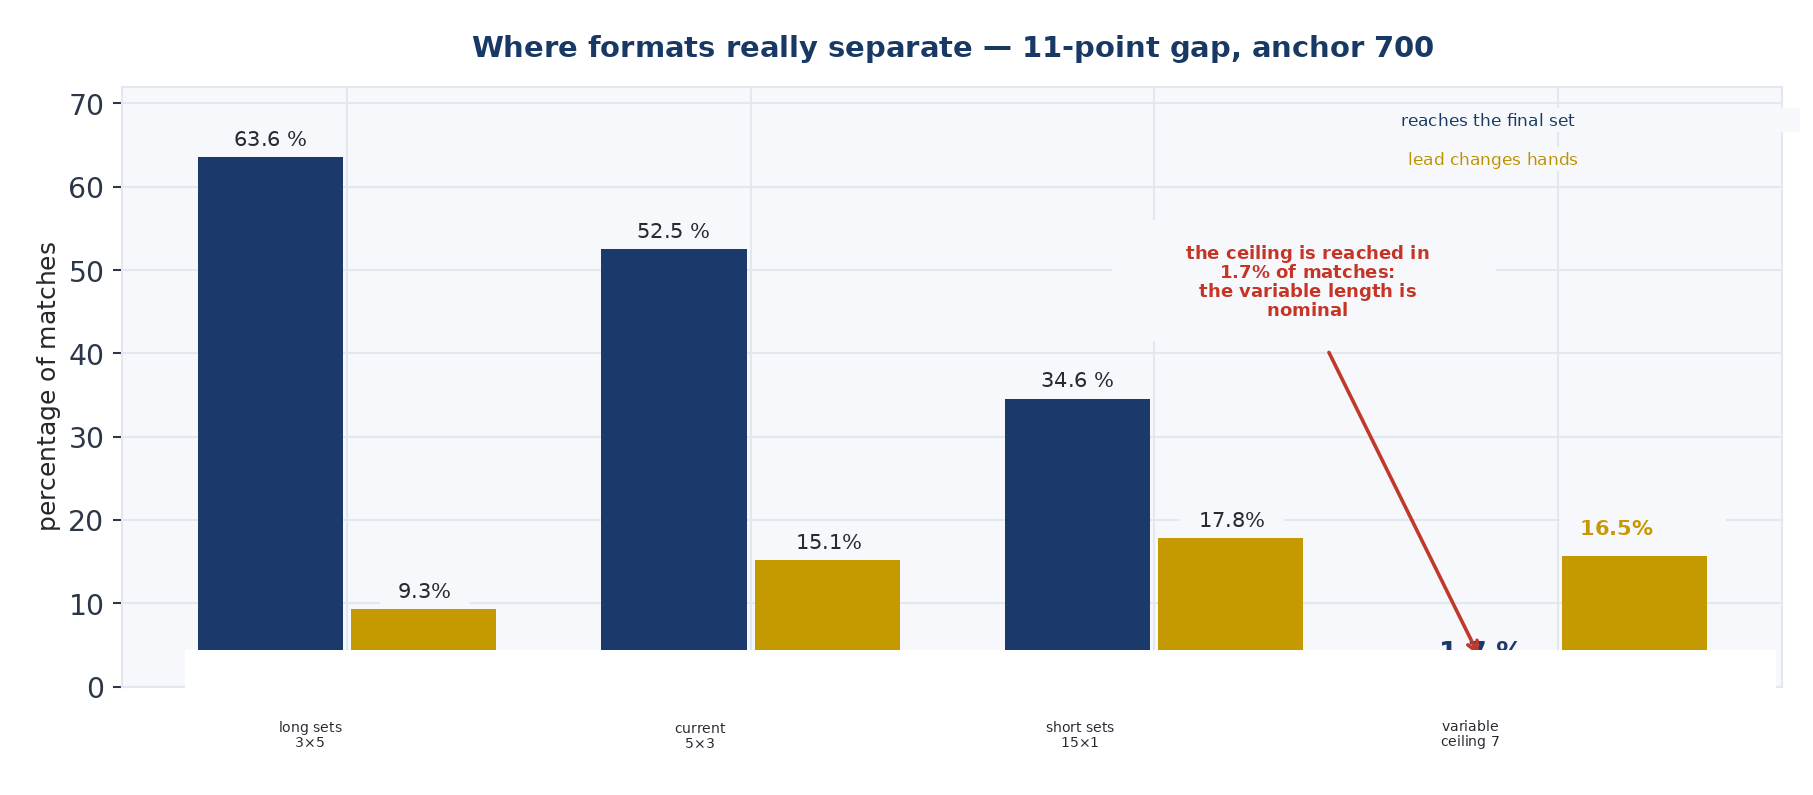
Figure 13. Where the formats really separate. Probability that the match reaches the last set and that the lead changes, for four formats. Gap of 11 points, anchor level 700.
34. The rule no format can break
A gate is needed, and it has to be placed before everything else: a format that changes the incentives of shooting is no longer measuring the same thing.
Imagine that under some rule it were advantageous, in some situation, to shoot differently from the way one would shoot to score as many points as possible. That format would be measuring a behaviour it had itself produced, and all its other numbers would become meaningless.
The risk is concrete, not theoretical. A format in which the margin by which a set is won counts could make it advantageous to take risks when already ahead. One with a cap could make it advantageous to drag the match out.
The check is done by listing every case, one by one, and it is possible because the ways a match can go are finite in number. They are all listed and it is verified that improving a set can never worsen one’s own position. For the current format there are 243 sequences; for 15 sets of one arrow there are over 14 million, and they are listed all the same.
The result is that every format and every structure passes, with zero violations. The gate therefore does not discriminate, and that should be said rather than presented as a result.
But “zero violations” means nothing until it has been shown that the check is capable of finding them. So I built three formats designed on purpose to violate, and put them through the same check. The first gives a bonus to whoever closes the match quickly, and the check finds 413 sequences in which it is advantageous to lose a set in order to win the next one sooner. The second makes whoever totals exactly six set points lose, and it finds 445. The third (at the cap, the archer who has lost fewer sets wins) does not violate, and I report it as a failed control: that criterion could not violate given the way it is built, so a broken check would have passed it just the same. Two controls out of three do their job; the third was badly constructed, and saying so is worth more than replacing it in silence.
The reason the gate does not discriminate is interesting, though. All the formats share the same property: the threshold ends the match as soon as it is reached, so scoring more points can never do harm. It is not that they are well designed, it is that they share the trait that makes neutrality automatic.
The only case in which the gate could have been tripped is the variable-length format, which has two termination criteria, the margin and the cap. With two criteria, neutrality is no longer guaranteed by the first. It passes, and the reason is precise: the two criteria are concordant — they measure the same thing, so reaching the cap rewards nobody differently from the way stopping earlier would reward him. A cap is safe as long as it resolves by the same criterion used to decide; a cap that resolved on the arrow total, or on the number of sets won instead of on points, would introduce a second ordering in conflict with the first and would have to be checked again.
35. How the pieces combine
We have four pieces measured separately: where the seeding comes from, what structure the bracket has, what format the match has, what rule settles a tie. They cannot be added, and we know this by measurement and not by precaution: a doubled qualification and reseeding together give less than the sum of their effects, because in part they buy the same thing. A design built by taking the best choice piece by piece would give a wrong number.
The set therefore has to be computed. and the sensible combinations number fifty-four: I computed them all. That count is the count of the space over which the four designs were optimised, and it does not include double elimination in the strict sense, which chapter 29 measures separately and which none of the four adopts.
On that set, however, I imposed a constraint that should be declared now, because it decides what the designs may contain: I admitted only configurations adoptable with the equipment an international competition already has today. Which excludes the one tie rule that would be more accurate than all the others (the sum of squared distances of chapter 12) because it requires measuring where each arrow landed within the ring. Automatic detection systems capable of transmitting the impact position exist and have been trialled in competition, but the systematic recording of coordinates is not part of the normal scoring flow, and I do not have an archive of individual coordinates this work could rely on. In chapter 40 I say what that constraint costs, which is the question an attentive reader asks at this point.
And since “best” depends on what one wants, three configurations emerge from the admitted set. In chapter 39 a fourth will be added, which does not arise from this optimisation but from a different question (how much can be gained without changing anything visible), and which for that reason is to be read alongside the others and not within the same ranking.
| Design | Maximises | Subject to |
|---|---|---|
| Precision | probability that the best archer wins | costing no more than twice the current competition |
| Spectacle | number of shoot-offs shot | being no less accurate than the current competition |
| Balanced | probability that the best archer wins | keeping at least half the shoot-offs and costing no more than 10% extra matches |
(The three optimisation problems, with the constraints written down before their solutions were computed: that is the condition for the three rows to be derived rather than chosen. There is a fourth row, “the most accurate of all with no constraint whatever”, which serves to measure how much is left on the table and is not a proposal — and which, as we shall see, coincides with the precision design.)
The spectacle design is not the slapdash one: it too is constrained, and its contribution is to quantify how much accuracy a point of spectacle costs. The three chapters that follow describe the three configurations in full, from the first arrow to the last.
36. The precision design
If the only objective were that the best archer should win, and we could change everything but the overall duration, the best competition would be this: seeding from the season ranking, bracket with reseeding, match played as 15 sets of one arrow, ties settled with TOTAL+.
It gives 14.2 times in a hundred against today’s 9.7: the title would go to the best archer one competition in seven instead of one in ten. Over a hundred editions of a championship, four and a half would end up with the right archer instead of somebody else.
Here is how it would run.
No qualification round is shot. The 64 archers enter the bracket according to the season ranking, the accuracy estimate computed from the qualification scores of competitions already shot in the preceding months, corrected for the difficulty of each competition using the procedure in chapter 46. Archers who have shot fewer than the required minimum enter at the bottom, ordered by the score of their last valid competition. This does away with the half-day of qualification, and the time saved is what pays for everything else.
The first round pairs the first in the ranking with the sixty-fourth, the second with the sixty-third and so on: 32 matches, as today.
The match is played as 15 sets of one arrow each. Every arrow is a set, and whoever puts it closer to the centre takes two points, one each in the event of a tie, and the match is won by whoever reaches sixteen. It sounds odd, but it is in fact the most accurate of the five formats tested, because it multiplies the occasions on which the difference in ability can show itself instead of grouping them into five blocks of three. If after 15 sets the score is fifteen-all, the archer with the higher total over the 15 arrows wins; if the totals are level too, one arrow is shot with the order drawn by lot.
From the second round onwards reseeding comes in, and here lies the most important difference, the one a federation has to organise. At the end of each round, the pairings for the next are not those fixed at the start: the survivors are reordered according to the ranking and the first is paired with the last, the second with the second-to-last, and so on.
An example makes clear what changes. If the number two and the number three go out in the first round as a surprise, today the number one would still face the opponent the bracket had assigned him months earlier. With reseeding he finds the weakest survivor in front of him: the bracket adapts to what has happened, instead of staying faithful to a prediction that has been refuted.
What this requires in practice is that the pairings for the next round be announced after the end of the previous one and not the day before. For broadcasting it is a real constraint, because the complete bracket cannot be printed in advance, and it is the organisational price of this design.
| Current competition | Precision design | |
|---|---|---|
| Title to the best | 9.7% | 14.2% |
| Matches played | 63 | 63 |
| Shoot-off arrows per tournament | 10.5 | 3.6 |
| Qualification rounds | 1% | 0 |
| Pairings announced | all at the start | round by round |
(Compact 64-archer field, twenty-five thousand tournaments from the same paired run, with the seed declared in the values file. The probability is that of the title going to the best archer in the field; the matches and shoot-offs are over a whole tournament.)
Four and a half titles in a hundred are gained, half a day of qualification is saved, and two thirds of the shoot-offs are lost. It is the format one would adopt for a competition in which the title counts above everything else — a world championship, an Olympic selection, a circuit final — in other words, if somebody were to demand an account of the fact that the best archer almost never wins.
It should be noted that it is not longer than the current competition; it is in fact shorter: the constraint on duration I had imposed in the optimisation did not turn out to bind. And there is a way of putting this that is worth more than the constraint itself: this configuration coincides with the best of the fifty-four combinations computed with no limit imposed at all. There is therefore no “expensive but more precise” competition that the constraint excluded: the frontier runs out earlier, and the most accurate configuration already fits inside the time a competition occupies today.
37. The spectacle design
If the objective were the maximum of what keeps the crowd engaged — shoot-offs, changes of lead, matches in the balance to the last — without, however, worsening accuracy relative to today, the competition would be this: qualification as today, bracket with quarter-final repechage, current format of 5 sets of three, and the tie rule in force. The title goes to the best archer 10.8 times in a hundred against the 9.7 of the current competition, and the matches go from 63 to 67.
The constraint is what makes the design serious: it is not the most spectacular competition in absolute terms, it is the most spectacular that costs no accuracy.
Here is how it would run. The qualification round is 72 arrows as today, with no change whatever. From the first round to the quarter-finals everything is identical to today (standard bracket, format of 5 sets of three, ties settled by the arrow), and this is the important part, because a spectator notices no difference at all until the quarter-finals.
After the quarter-finals lies the only change, and it is the one that adds spectacle. The four archers eliminated in the quarter-finals do not go home: they play two semi-finals and a final among themselves, three matches in all. Whoever comes out of it then faces, in a play-off, the lowest-seeded of the four quarter-final winners, who is therefore the only one who has to defend his place, while the three higher-ranked stay where they are. Four extra matches, and the tournament goes from 63 to 67.
Why the quarter-finals, and not earlier? Because that is where elimination does the most damage. A strong archer who goes out in the quarter-finals is the most costly loss in the whole bracket (he got that far, so he is probably strong, and the bracket throws him away over a single match), whereas offering a second chance further back makes things worse, as chapter 30 showed.
| Current competition | Spectacle design | |
|---|---|---|
| Title to the best | 9.7% | 10.8% |
| Matches played | 63 | 67 |
| Shoot-off arrows per tournament | 10.5 | 11.2 |
| Matches with a second chance | 0 | 4 |
(Compact 64-archer field, twenty-five thousand tournaments from the same paired run, with the seed declared in the values file. The four extra matches are the two semi-finals, the repechage final and the play-off for re-entry to the semi-finals.)
Four extra matches, and with them seven tenths of a shoot-off arrow more per tournament, and a new phase that is an event in itself: four eliminated archers shooting for re-entry, with a semi-final place at stake. And all of this without losing accuracy, because it gains 1.1 points — giving the quarter-finalists a second chance corrects the most costly error rather than adding to it.
One point one is very little, and I should say so plainly, and it should be read in its own units: it is the frequency with which the tournament ends with the best archer on top, not the number of matches whose outcome changes. On a circuit of ten competitions a year it means one more title every nine seasons. Converting it into matches by multiplying by sixty-three would be invalid: the frequency with which the best archer wins and the number of matches whose outcome changes are two different quantities.
This design is therefore not to be proposed for its accuracy: it is to be proposed for what it adds, and the fact that it does not worsen accuracy is its admission requirement, not its merit. It is the format for a competition in which the crowd and the broadcast matter more than the title — a circuit stage, a final in a city centre, an event conceived to be watched. And it is the only one of the three configurations that costs anything: four matches, about an hour, spent to buy spectacle and not accuracy.
38. The balanced design
If we wanted to take nothing away from anybody (same matches, same shoot-offs, same format, same duration), how much could be gained? It is the question a federation actually asks, because it is the only one that does not require persuading somebody to give something up.
The answer is four titles in a hundred. The competition would be: seeding from the season ranking, bracket with reseeding, current format of 5 sets of three, tie rule in force. The title goes to the best archer 13.7 times in a hundred against today’s 9.7, a little under one competition in seven instead of one in ten.
The 64 archers enter the bracket according to the season ranking, the same accuracy estimate described in chapter 31, built on the qualification scores of previous competitions and not on the placings obtained. The qualification round can remain, as a moment of competition and in order to rank those without a ranking, but it no longer determines the bracket. The match is identical to today, 5 sets of 3 arrows, first to six. The tie is settled with the shoot-off arrow, identical to today. And the bracket uses reseeding: after each round the pairings are recomposed according to the ranking, the highest-ranked against the lowest remaining.
| Current competition | Balanced design | |
|---|---|---|
| Title to the best | 9.7% | 13.7% |
| Matches played | 63 | 63 |
| Shoot-off arrows per tournament | 10.5 | 10.4 |
| Match format | 5 sets of 3 | 5 sets of 3 |
| Tie rule | Tie rule | Tie rule |
| arrow | Duration | Duration |
| Arrows shot | as today | as today |
(Compact 64-archer field, twenty-five thousand tournaments from the same paired run, with the seed declared in the values file. The ranking composing the bracket is the 10-competition one, produced by the procedure of Part Three.)
It gains four titles in a hundred while keeping everything identical: the same 63 matches, the same format, the same tie rule, the same duration. The shoot-off arrows remain about what they are today, 10.4 against 10.5, and the difference does not come from the rule, which is the same, but from the fact that with a different bracket different pairings meet. All that changes is where the seeding comes from and how the survivors are paired: two lines of the rulebook, zero arrows, zero minutes.
Why it works: the total is not the sum of the parts. The two interventions act on the same thing, the error in the seeding, but from opposite sides. The season ranking reduces the error, because it knows who is the better archer far better than an afternoon of qualification does. Reseeding converts that knowledge into pairings, and without it a better seeding is worth almost nothing, as chapter 31 showed.
The numbers say it precisely. Applied together, seeding from the ranking and reseeding take today’s competition from 9.7 to 13.7 per cent: four points, and it is the measurement that counts because it comes from the same run as all the other configurations. A dedicated experiment, which serves to decompose that gain and not to replace its level, says that the two interventions taken separately are worth half a point and one point one: added together they would make a little over one and a half, whereas together they make more than twice that.
It is the only time in this whole work that two interventions multiply instead of adding, and the reason is that neither is of any use without the other — good information that nobody uses, or a mechanism that uses bad information.
The two changes are drafted as follows.
Article — Composition of the bracket
1. The elimination bracket shall be composed according to the seasonal ranking in force at the date of the competition, computed on the qualification round scores of the competitions on the official calendar in accordance with the procedure set out in the technical annex. Athletes without a valid ranking shall be placed at the bottom, ordered according to the score of the day’s qualification round.
2. At the end of each round, the pairings for the following round shall be recomposed according to the ranking: the athlete with the best position among the qualifiers shall face the athlete with the worst position, the second shall face the second-to-last, and so on.
3. The pairings for each round shall be made known within thirty minutes of the end of the previous round.
What it requires in practice is little, but it has to be stated. A published and updated seasonal ranking is needed, which is the product of Part Three and which a federation has to build before it can adopt this design. A willingness is needed to announce the pairings round by round rather than the day before, which is a constraint for broadcasting — although thirty minutes between one round and the next is already allowed for in the competition schedule. And a rule is needed for archers without a ranking (a newcomer, an athlete back from injury, an invited competitor), which the first paragraph settles in the simplest way, placing them at the bottom ordered by the score of the day.
It is the only one of the three proposals that requires taking nothing away from anybody: not a match, not a shoot-off, not a minute, not an arrow. That is why it is the one I would deliver first.
There remains a limitation that should be attached to the result rather than put in a footnote: this design rests entirely on seeding from the ranking. Without it — composing the bracket from the day’s qualification — the gain falls from four titles in a hundred to one. They are two different recommendations, and the first holds only if a federation is willing to use the season ranking to compose the bracket.
39. The minimal design: improving without changing anything visible
The three preceding designs all ask for a change in something the public sees: pairings announced round by round, a repechage after the quarter-finals, a seeding that no longer comes from the score of the day. They are modest changes, but they have to be explained to somebody, and in a federation explaining is expensive.
There is therefore a fourth design that deserves to stand alongside the other three, and it answers the most practical question of all: how much can be gained without touching anything that is seen? Same 72-arrow qualification, same 64-archer bracket, same five sets of three, same duration, same order of the day, changing only how the results the competition already produces are read.
I call it the minimal design, and it is not the most accurate of the four: it is the one that asks least.
There are three possible interventions, and I separate them because their prices are very different, and because two of them — the two tie rules — are alternatives to each other and cannot both apply to the same match.
The first costs nothing and is the tie rule. Replacing the shoot-off arrow with TOTAL+ — giving the win to whoever scored more over the 15 arrows and shooting only if the totals are level too. It is the proposal of chapter 18, and it requires nothing that is not already on the judge’s table.
The second requires instrumentation but is invisible: ordering the qualification by distances. Today the qualification ranking is drawn up on the ring total, and ties are broken by the X count and then by tens. If where each arrow landed within the ring were recorded, the same competition — same 72 arrows, same half-day — would produce a more faithful ranking. Nothing changes for the spectator: the archers shoot the same arrows and the bracket is composed in the same way, only the order is fairer.
| How the qualification is ordered | The first is the best | The top eight | Mean error | Agreement with the true order |
|---|---|---|---|---|
| Total, ties by lot | 14.0% | 0.04% | 8.62 places | 0.819 |
| Total, then Xs | 14.2% | 0.04% | 8.60 | 0.820 |
| Total, then Xs, then tens — today’s rule | 14.2% | 0.04% | 8.61 | 0.819 |
| Sum of squared distances | 15.9% | 0.09% | 7.70 | 0.855 |
(64 archers between 690 and 665, 72 arrows, one hundred and twenty thousand simulated qualifications. Ties are broken by lot and not by ranking order, otherwise the comparison would artificially favour the criteria that tie most often. Standard error on the top qualifier: from ±0.10 to ±0.11 points.)
Two things are to be read in that table. Distances reduce the mean positional error by almost a whole place, from 8.61 to 7.70, and take the top qualifier from 14.2 to 15.9 times in a hundred, a difference twelve times larger than the error of the measurement — one that chance cannot explain. And they identify exactly the best eight more than twice as often as the ring-based criteria, which are indistinguishable from each other.
The tie-break criteria the rulebook uses today, by contrast, do almost nothing: adding the X count is worth two tenths, adding the ten count as well is worth nothing. Here they do no harm as they do in a match, because in a ranking there is no tie on totals to reverse them; they simply add no information.
The third intervention is the tie rule read on distances: giving the match to whoever has the smaller sum of squares over the 15 arrows. It requires the same instrumentation as the second.
Here is what they produce, taken one at a time and all together, on a competition otherwise identical to today’s.
| Order of the qualification | Tie rule | Title to the best | Gain |
|---|---|---|---|
| rings, Xs, tens | Shoot-off arrow | 9.7% | — today’s competition |
| rings, Xs, tens | TOTAL+ | 10.0% | 0.3% |
| distances | Shoot-off arrow | 10.3% | +0.5 |
| rings, Xs, tens | distances | 10.4 | 0.7 |
| distances | TOTAL+ | 10.6 | 0.8 |
| distances | distances | 10.8% | +1.1 |
(Standard 64-archer bracket, compact field between 690 and 665, twenty-five thousand tournaments from the same paired run, with the seed declared in the values file, with the match matrices in closed form. Format, duration and structure are identical in every row; the only thing that changes from one row to the next is how the results are read.)
Every row of this table and the five designs of the next chapter come from the same paired run, so their levels are directly comparable. The column to look at is the last: the gains are comparisons with everything else held equal — same fields, same qualifications, same match outcomes, only the reading changed — and on a comparison like that the error is much smaller than on the levels.
There are four numbers to keep.
TOTAL+ on its own is worth 0.33 points and costs nothing. It is the only intervention in this whole volume adopted with one line of the rulebook and zero investment.
Ordering the qualification by distances is worth half a point, and this corrects what I had written in the first draft. The contrast measured on the decision run is +0.5 points with an error of 0.3: the sign is positive and the value exceeds the error by a little over a factor of two, so the effect is there but is not precisely measured. The first edition reported here that ordering by distances was worth nothing, and that number came from a contrast measured on a different run: the table above and the producer say otherwise, and they are the ones that stand.
Let me distinguish what improves from what does not, because the two questions are different. Ordering by distances improves the seeding markedly: it puts the best archer first 15.9 times in a hundred instead of 14.2, and reduces the mean error from 8.6 places to 7.7. On the title the effect is much smaller, half a point, and the reason deserves to be understood: the bracket does not consult the ranking in order to know who the best archer is, it consults it in order to decide who meets whom. What matters is how it distributes the opponents across all sixty-three matches, not how well it gets the top positions right. A far more accurate seeding at the top produces a modest gain in titles.
Reading distances in the tie is worth 0.7 points, against TOTAL+’s 0.33, because it acts where the information is scarcest. The margin over the free solution is narrow, however: if a federation had to buy instrumentation for one reason only, this would be it, but the honest comparison is seven tenths against three, in exchange for an investment TOTAL+ does not require.
And the two that can coexist (ordering the qualification by distances and settling ties on the same measurement) are together worth 1.1 points, taking today’s competition from 9.7 to 10.8 times in a hundred.
There is also a middle way, for anyone who buys the instrumentation and does not want to touch the tie rule too much: ordering the qualification by distances and settling ties with TOTAL+ is worth 0.8 points. It is less than the 1.1 of the full pair and more than the 0.7 of the distance-based tie rule alone, and it has the merit of leaving the tie rule in a form that can be verified by eye. Less than the sum of the two taken separately, 0.5 plus 0.7, because in part they buy the same thing.
Barely a point is little, and that should be said. Over a hundred tournaments it means one more title awarded to the right archer: on a circuit of ten competitions a year, some ten seasons for one title. But the right comparison is not with zero, it is with the other possible interventions — the balanced design of chapter 38 is worth 4.0, four times as much, and it requires neither instrumentation nor investment.
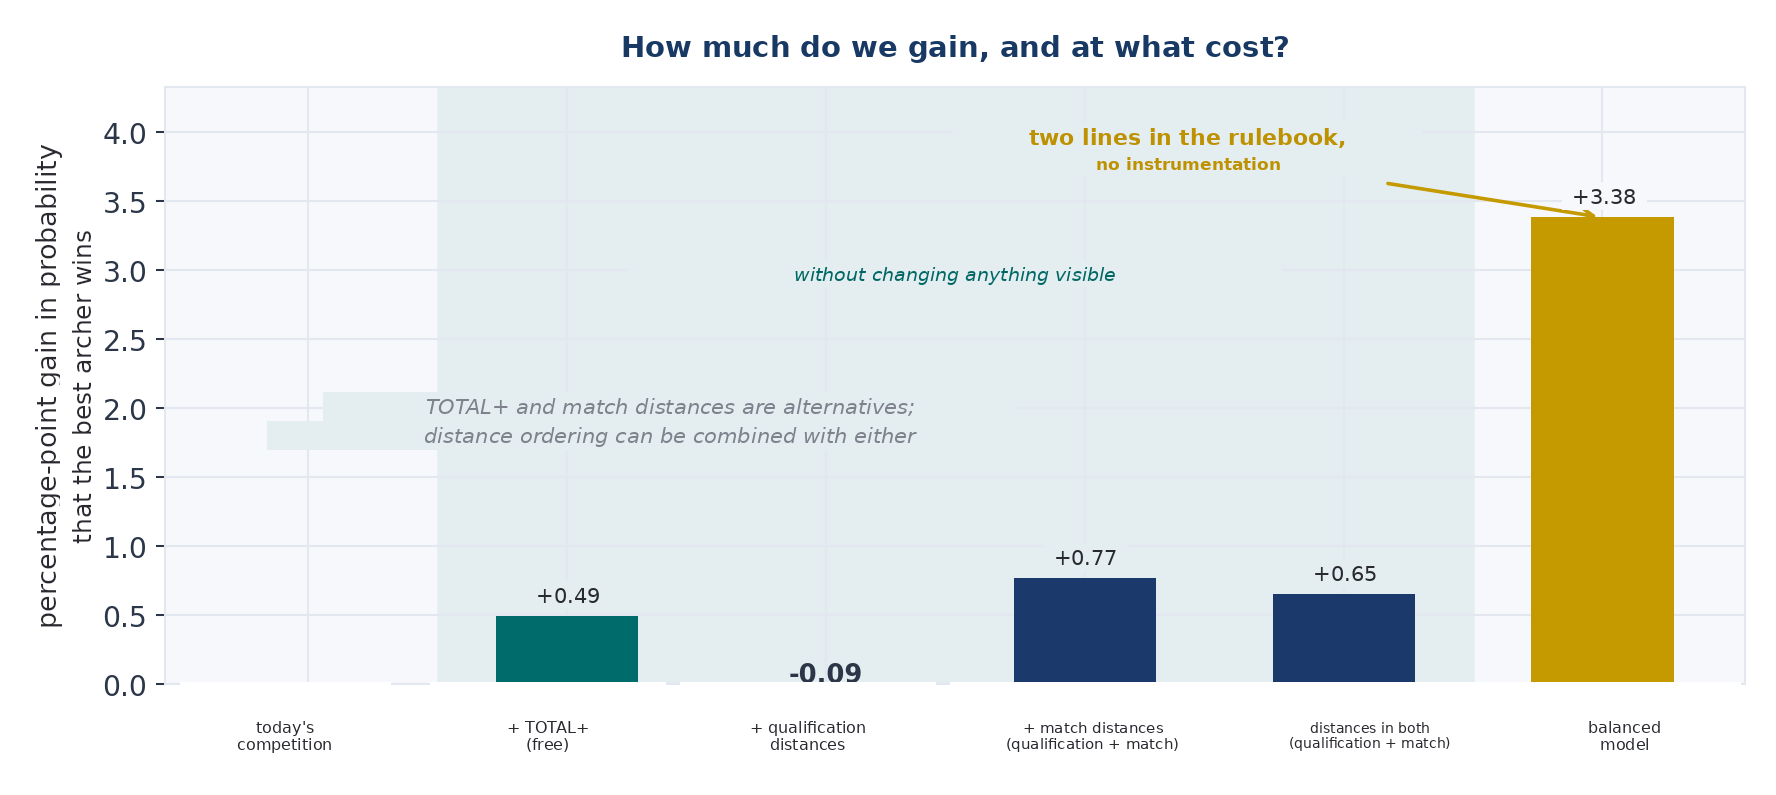
Figure 14 — How much is gained, and at what price. Points gained on the probability that the title goes to the best archer, relative to today’s competition. Compact 64-archer field, all columns from the same run: twenty-five thousand tournaments from the same paired run, with the seed declared in the values file. The first four change nothing that is seen; the last requires two lines of the rulebook and no instrumentation. The interventions at unchanged format do not add to the balanced design: they are alternative routes. And among them, the two tie rules — TOTAL+ and distances — are in turn alternatives: the minimal design uses distances.
Anyone unwilling to change anything visible but able to record distances gains 1.1 points by making both interventions. Anyone without the instrumentation can choose TOTAL+, which is worth 0.33 and costs nothing. Anyone prepared to change two lines of the rulebook gains 4.0. The difference between the two routes is not technical: it is how much one is prepared to explain.
40. The four compared
The four competitions described in the preceding chapters come from the same machinery and the same set of combinations: what distinguishes them is the question they answer. Set side by side, with the current competition as the benchmark, what each costs and what each gives can be read at a glance.
| Current competition | Minimal | Spectacle | Balanced | Precision | |
|---|---|---|---|---|---|
| Title to the best | 9.7% | 10.8% (+1.1) | 10.8% (+1.1) | 13.7% (+4.0) | 14.2% (+4.5) |
| Matches played | 63 | 63 | 67 | 63 | 63 |
| Shoot-off arrows per tournament | 10.5 | 0.0 | 11.2 | 10.4 | 3.6 |
| Qualification | 72 arrows | 72 arrows | 72 arrows | 72 arrows | none |
| Match format | 5 sets of 3 | 5 sets of 3 | 5 sets of 3 | 5 sets of 3 | 15 sets of 1 |
| Tie rule | Tie rule | distances | Tie rule | Tie rule | TOTAL+ |
| Bracket | standard | standard | Repechage | Reseeding | Reseeding |
| Instrumentation needed | no | yes | no | no | no |
(On the probability that the title goes to the best archer, the minimal and the spectacle designs give the same number: two hundredths of a point separate them, against an error of two tenths, and this grid does not distinguish them. They are chosen for what they preserve — the minimal changes nothing visible, the spectacle keeps the shoot-offs and adds matches — not for what they are worth. Compact 64-archer field. The shoot-off arrows row counts how many times in a tournament one is actually shot, not how many matches might call for one. *In the balanced design the qualification round may remain as a moment of competition but does not determine the bracket. All five configurations come from the same paired run.)
How does one choose among the four? Not with a calculation, because the choice depends on what a competition is supposed to do, and that is a decision that does not fall to whoever does the arithmetic. But four things the calculation does say.
The complete minimal design is worth 1.1 points, one title in a hundred, and it requires distances to be recorded both to order the qualification and to settle ties: the second intervention is worth 0.7 and the first 0.5, and together less than the sum. For anyone without the instrumentation there is a simpler variant still, TOTAL+, worth 0.33 and requiring only a regulatory change. It should be chosen if changing two lines of the rulebook is harder than acquiring some instruments, which in some federations it is.
The precision design is the most accurate and costs less than today, because it does away with the qualification round; its price is paid in shoot-offs, which fall from ten and a half to three point six per tournament, and in organisational flexibility.
The spectacle design is the only one that costs anything — four matches, about an hour — and its gain in accuracy is negligible, so it should be chosen for what it adds and not for what it improves.
And the balanced design gains almost as much as the precision one while taking nothing away: 4.0 points against 4.4 — 89 per cent of the maximum gain at zero cost.
If I had to deliver only one, I would deliver the balanced design — not because it is the best, but because it is the only one nobody has any reason to refuse.
The design that cannot yet be built
At this point the most obvious question of all has to be asked. Part One established that reading the distances of the 15 arrows is the most accurate way of settling a tie. Why, then, does none of the four designs use it?
The answer lies in the constraint declared in chapter 35: I admitted only configurations adoptable with existing equipment. That constraint has a price, however, and the price can be measured.
| Tie rule, with everything else held equal | Title to the best |
|---|---|
| Draw | 9.6% |
| Shoot-off arrow, the rule in force | 10.0% |
| TOTAL+ | 10.4 |
| Sum of squared distances | 10.8% |
(Standard bracket, compact 64-archer field between 690 and 665, 40,000 tournaments from the same run, seed declared. Only the tie rule changes; everything else — seeding, bracket, match randomness — is held fixed, so that the four rows are comparable with each other. It is a run of its own for this comparison: its level for the rule in force is not to be read as the current competition in the table of five designs, which comes from the single run and is 9.7 per cent.)
Within this table, moving from the arrow to TOTAL+ is worth four tenths on the title, and moving from TOTAL+ to distances is worth as much again. These are differences internal to this run: the gain from TOTAL+ measured in the single run of the designs, which is the value the recommendations cite, is 0.33 points, and it is the single most valuable intervention on the tie rule among those requiring no new instrumentation; reading distances is worth 0.7, and does require it.
Applied to the precision design, which with TOTAL+ reaches 14.2 per cent, replacing the rule with distances takes it to 14.6: three and a half tenths more, with an error of about two and a half tenths on each of the two levels. Here is why, and it is instructive. In the fifteen-sets-of-one-arrow format the match reaches a tie far more rarely, and when it does the two archers have shot fifteen arrows divided into fifteen sets, which is a more selective condition than five-all. The distance rule is invoked less often and decides less well, and the gain that is worth eight tenths on the standard bracket does not carry over here. Extrapolating it would have promised fifteen times what is there.
It does not change the order of the four designs and it does not change the recommendation: the balanced design remains the one adoptable without persuading anybody. But it does say something worth keeping: the piece of a competition on which there is still something to gain is neither the format nor the bracket, it is the instrumentation.
Let me be precise about how large that something is, because it is easy to read it as more than it is. Half a point is half a title every hundred tournaments, and it should be read in that unit: it does not convert into changed matches by multiplying by sixty-three, because the frequency with which the tournament ends with the best archer on top and the number of matches whose outcome changes are two different quantities. It is the kind of gain that justifies an investment if that investment is good for other things too — and electronic reading of the point of impact would be good for a great deal else, starting with disputes over judging calls at the target — while it does not justify one on its own.
And there is a stronger reason for wanting it, one that does not run through accuracy. With coordinates recorded, the part of these pages describing how archers shoot would stop being an assumption and become a measurement. The counterfactual tournaments and rulebooks would remain simulations, because a competition that was not shot cannot be observed: what would change is the distribution the simulation starts from. The clearest case is the shape of the tail: in chapter 21 there remains the open number on which it depends whether TOTAL+ is the right choice or an insurance policy is needed, and today it cannot be estimated. With distances recorded it would be estimated in one season.
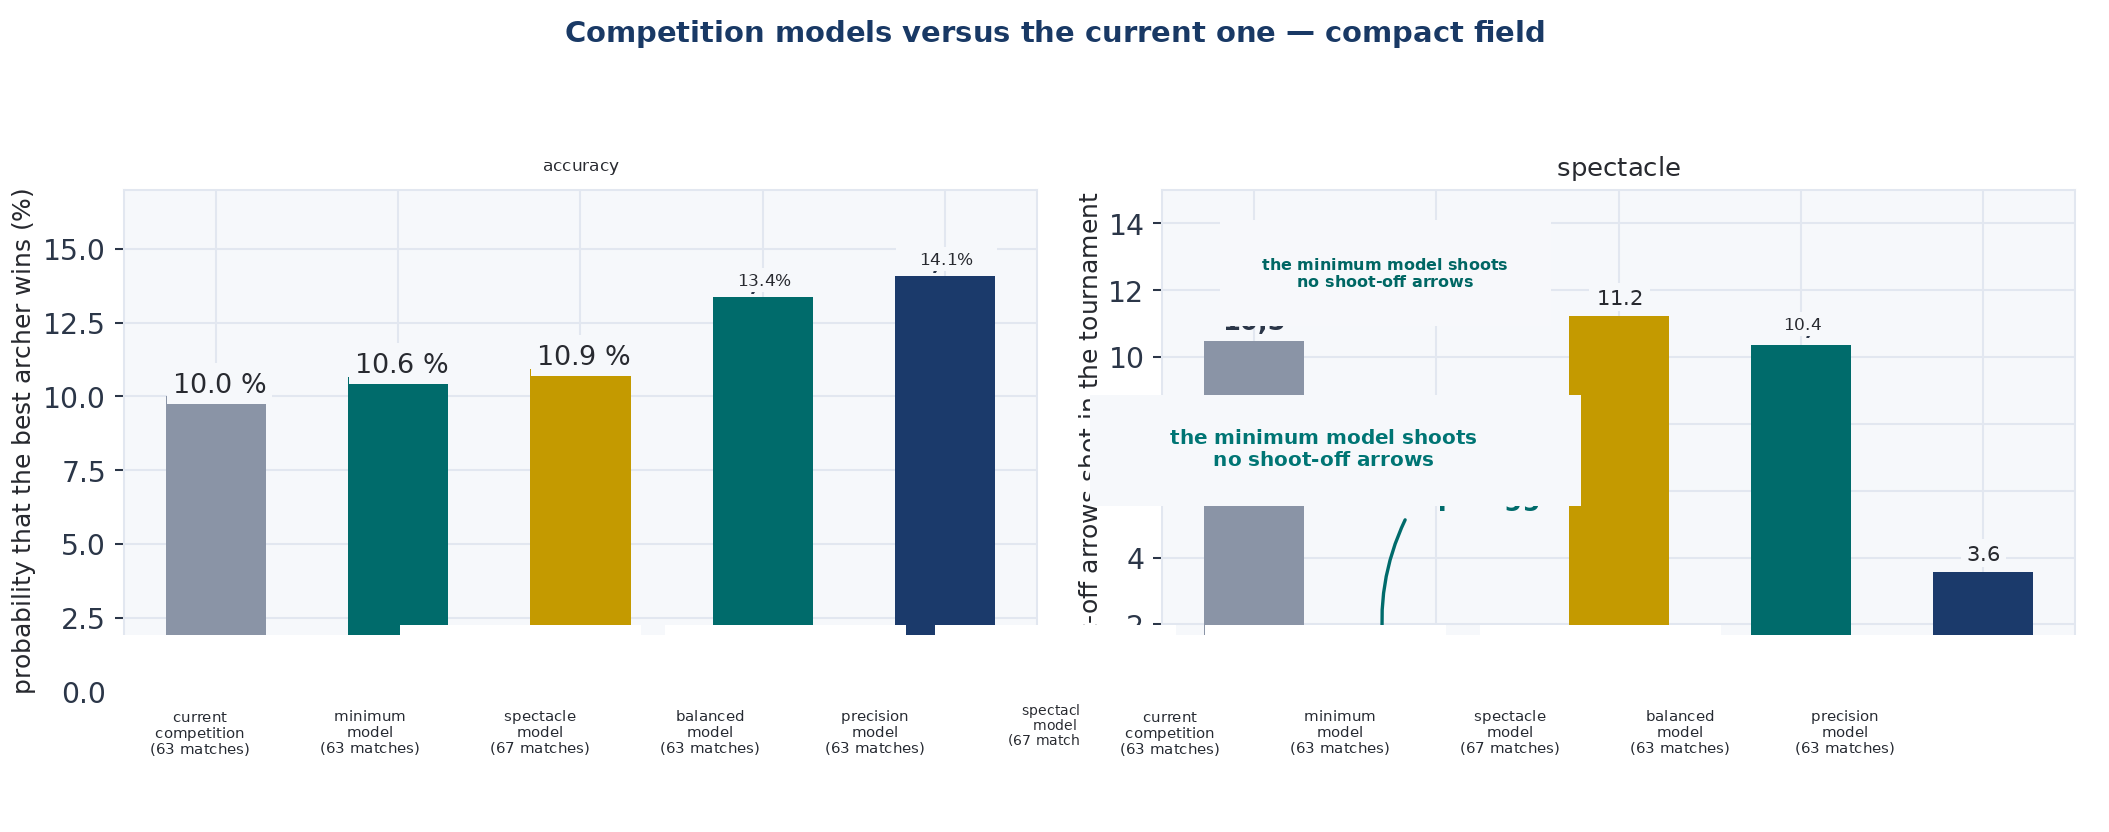
Figure 15. The competition designs. Probability that the best archer wins and shoot-off arrows shot in the tournament, for the three designs and for the current competition. The matches played are not the same in all of them: the quarter-final repechage adds four, and the figure reports them under each design. Compact 64-archer field, twenty-five thousand tournaments from the single run of the designs, with the seed declared in the values file.
41. What to take away from Part Two
The seeding is far worse than is generally believed. In a compact field a 72-arrow qualification round practically never gets the best eight right — four times in ten thousand — and is off by 8.6 places on average.
Every structure that consults the seeding inherits its error in proportion to how often it consults it. A structure consulting it once, the standard bracket, pays seven tenths of a point. One consulting it twice, like the repechage, pays one point six. One consulting it at every round, reseeding, pays four point eight.
Double elimination with a single final costs twice the matches and yields less than reseeding, and the best dose of repechage is neither zero nor everything: from the round of 16 onwards, that is, the fifteen archers eliminated between the round of 16 and the final, which is worth 11.8 against the 11.1 of the quarter-finals alone.
Using the season ranking as the seeding beats doubling the qualification round, and it costs nothing because those data already exist.
The match format does not matter. The three constant-arrow formats lie within a third of a match per tournament, the two variable-length ones do worse by almost a whole match, and the choice is entirely one of spectacle.
42. The opposite problem
The first two parts have the same shape: very little data, and ceilings that say how little can be obtained. Fifteen arrows to decide a match, one arrow to settle a tie, seventy-two to order sixty-four archers. Every time the conclusion is that the margin exists and is narrow.
This part is the opposite problem. A whole season, ten competitions, seven hundred and twenty arrows per athlete: data in abundance, and the question becomes what can be extracted from them. It is the same model in the opposite regime, and the conclusion reverses: it is not that ability is indistinguishable, it is that a single competition is too short an instrument.
The reversal can be quantified at once, and it is the number that holds the volume together. In the two scenarios modelled here (a tournament of 64 archers, a season of 32) the tournament identifies the best archer in the field ten times in a hundred and the season three times in four. The two figures do not come from a controlled comparison: the populations are different, and the ratio is to be read as the distance between two scenarios and not as the relative efficiency of two systems.
And this part does not serve only to crown somebody in December. Part Two showed that the season ranking can be the seeding on which a bracket is built, and that in that role it is worth more than any other intervention. The instrument that follows therefore serves twice over: for the end-of-year award and for deciding who meets whom in May.
43. What “best of the year” means
Before the procedure, the question the procedure has to settle. There are at least four possible answers, all defensible.
The first is whoever won most, which is the criterion of the points circuits: points are awarded for placings and added up. It has the merit of rewarding those who win when it counts, and the defect of inheriting the randomness of the bracket, which Part Two measured: the title goes to the best archer one competition in ten. The placing is therefore a very noisy signal per competition — it does not follow that the ranking inherits nine tenths of the noise, because summing ten competitions recovers part of it, and indeed with full calendars the points table reaches 72.7 per cent.
The second is whoever shot the highest scores: the mean of the qualification scores. It measures accuracy rather than results and is far more stable, but it compares scores shot under different conditions, and chapter 45 shows what that costs.
The third is whoever was most consistent, which rewards the archer who has no bad days. It is a real quality, but it is a different thing from accuracy and should be measured separately rather than confused with it.
The fourth is whoever shot best this year — whoever had the highest mean level across the season. This is the one I adopt, consistently with the definition in Part One: the archer of the year is the one whose accuracy, averaged over the whole season, comes out highest. Not whoever won most, not whoever had the best peak; whoever, on stepping to the line, expected the highest score on average.
Distinguish it from a fifth that resembles it and is not the same: whoever would shoot best tomorrow, that is, whoever is strongest now. They are two different questions, and the annual award is retrospective — it is given for what was done during the season, not for a prediction. There is also a more binding reason for not adopting the fifth here, and I state it because it is a limitation and not a preference: the model in these pages holds the level fixed throughout the season, and inside that world weighting recent competitions more heavily can only lose information. Anything I said about current form would be a consequence of the assumption and not a measurement. In chapter 57 I measure how well that assumption holds.
The reason for the choice is the same as in chapter 2: it is the only one of the four that can be checked. One can say with a number how often a procedure gets it right, because one can simulate a world in which the answer is known and count how often the procedure arrives at it. With “whoever won most” one cannot, because the answer is by definition the one observed.
And there is a practical reason worth twice as much: if the ranking is to serve as a seeding, it has to predict who will shoot better and not record who won, because a seeding is a prediction and has to be built as one.
44. How much a season can tell apart
Before building the instrument, the limit within which it will have to sit. The table reports two columns per cell: what would be obtained by reading the exact coordinates, and what is obtained by reading the rings, which is what a real ranking has available.
| Gap | 1 competition | 5 | 10 | 20 | 100 |
|---|---|---|---|---|---|
| rings / coord. | rings / coord. | rings / coord. | rings / coord. | rings / coord. | |
| 1 point | 57.1 / 58.5 | 65.4 / 68.5 | 71.5 / 75.2 | 78.9 / 83.2 | 96.4 / 98.4 |
| 2 points | 64.0 / 66.5 | 78.7 / 83.0 | 87.0 / 91.1 | 94.4 / 97.2 | 100 / 100 |
| 3 points | 70.1 / 73.6 | 88.1 / 92.1 | 95.3 / 97.7 | 99.1 / 99.8 | 100 / 100 |
| 5 points | 80.7 / 84.9 | 97.4 / 99.0 | 99.7 / 99.9 | 100 / 100 | 100 / 100 |
(How often in a hundred the better of two archers is correctly identified. One competition is a round of 72 arrows. Anchor level 700. It is formula S5 evaluated at large n, that is, S15, and it is an upper bound: known model and optimal reading.)
And conversely, how many arrows are needed to get it wrong no more than once in twenty.
| Gap | Reading the rings | Reading the coordinates | Cost of the scorecard |
|---|---|---|---|
| 1 point | 6,052 arrows (85 competitions) | 4,202 (59 competitions) | 1.44 times |
| 2 points | 1,542 (22 competitions) | 1,073 (15) | 1.44 |
| 3 points | 698 (10 competitions) | 487 (7) | 1.43 |
| 5 points | 261 (4 competitions) | 183 (3) | 1.43 |
(Smallest whole number of arrows for which reliability reaches 95 per cent; the competitions are rounded up. Anchor level 700.)
The row to keep is the third. A season of 10 competitions tells apart two archers three points apart out of 720 with a reliability of 95.3 per cent, which is the threshold adopted here and not a certainty: out of twenty such pairs it gets one wrong. Ten competitions are enough, and they are exactly what a national calendar offers.
But the first row states the limit, and it is stark. To tell apart two archers one single point apart would take 85 competitions, that is, eight and a half seasons at a full calendar. An archer would have to shoot from twenty to twenty-nine years old for the ranking to be able to say, at the 95 per cent reliability adopted here, whether he is one point out of seven hundred and twenty more accurate than a contemporary. It is not a mathematical impossibility: it is a calendar no federation can shoot.
This number is the constraint within which everything else in Part Three has to sit, and it should be kept in mind when we come to the admission rules: no more refined procedure is needed to distinguish one point, because the limit is not in the procedure.
In passing: reading the rings instead of the coordinates costs 44 per cent more arrows, and the ratio is the same across all four gaps: 1.44, 1.44, 1.43, 1.43. It is not a threshold effect, it is a rate, and formula S16 shows why it is constant. It reappears here identical to how it appeared in Part One.
45. Why one score cannot be compared with another
And here is the problem that makes a season ranking non-trivial, and that no sum of scores solves.
A 685 shot in wind and a 685 shot on a perfect day are not the same performance. Every competition has its own conditions — wind, light, altitude, temperature, quality of the field — and those conditions act on everyone present together (formula S17).
It follows that two archers who have shot at different competitions are not comparable on raw scores. And since nobody enters everything, this is not an exception: it is the rule.
| Overlap of the calendars | No effect | 5-point effect | 11-point effect |
|---|---|---|---|
| 0% — all different competitions | 95.3 | 84.4 | 71.7 |
| 50% | 94.8 | 88.9 | 76.9 |
| 100% — same competitions | 95.1 | 94.8 | 94.1 |
(Ranking built on the mean of the scores. Gap of 3 points, 10 competitions of 72 arrows, anchor level 700, 4,000 seasons per cell.)
Read the last column from top to bottom. With conditions that move the scores by eleven points, as on a day of strong wind, two archers who have shot at the same competitions are ordered correctly 94 times in a hundred; two who have shot at entirely different competitions, 72. A difference of twenty-two in a hundred, for something that has nothing to do with shooting.
The reason is simple. If two archers have shot at the same competitions, they both had April’s wind, and in the comparison it cancels out. If they have shot at different competitions it does not cancel at all, and it becomes pure noise that the ranking mistakes for ability.
And here is the result that makes this whole part adoptable. Redoing the same measurement with the joint estimation of chapter 46 instead of the mean of the scores, the dependence on the calendar is no longer visible: among the designs in which the archer–competition graph remains connected (one, two or three competitions in common) the reliability is 64.5, 64.6 and 64.6, indistinguishable within an error of four tenths on each. With the mean of the scores, in the same scenario, twenty-two point four separate the extremes.
I do not make the comparison with the entirely disjoint calendar, and here is why. With zero competitions in common the graph is not connected in any of the simulated seasons, and with the competition effects estimated jointly with the levels, the difference in origin between two separate components is not in the data: any number that comes out of there comes from the minimum-norm solution, that is, from a numerical detail. It is the same reason chapter 50 keeps the two-disjoint-blocks row off the scale, and why chapter 46 and appendix S18 say so at length. What the measurement supports is that among connected calendars the overlap stops mattering; not a ratio between a connected case and a case the model cannot read.
Which changes the recommendation for the better. Not “coordinate the calendars”, which would require getting dozens of parties to agree, but: the calendar problem is solved in the way the calculation is done. It is an intervention made once, and it requires nobody’s consent.
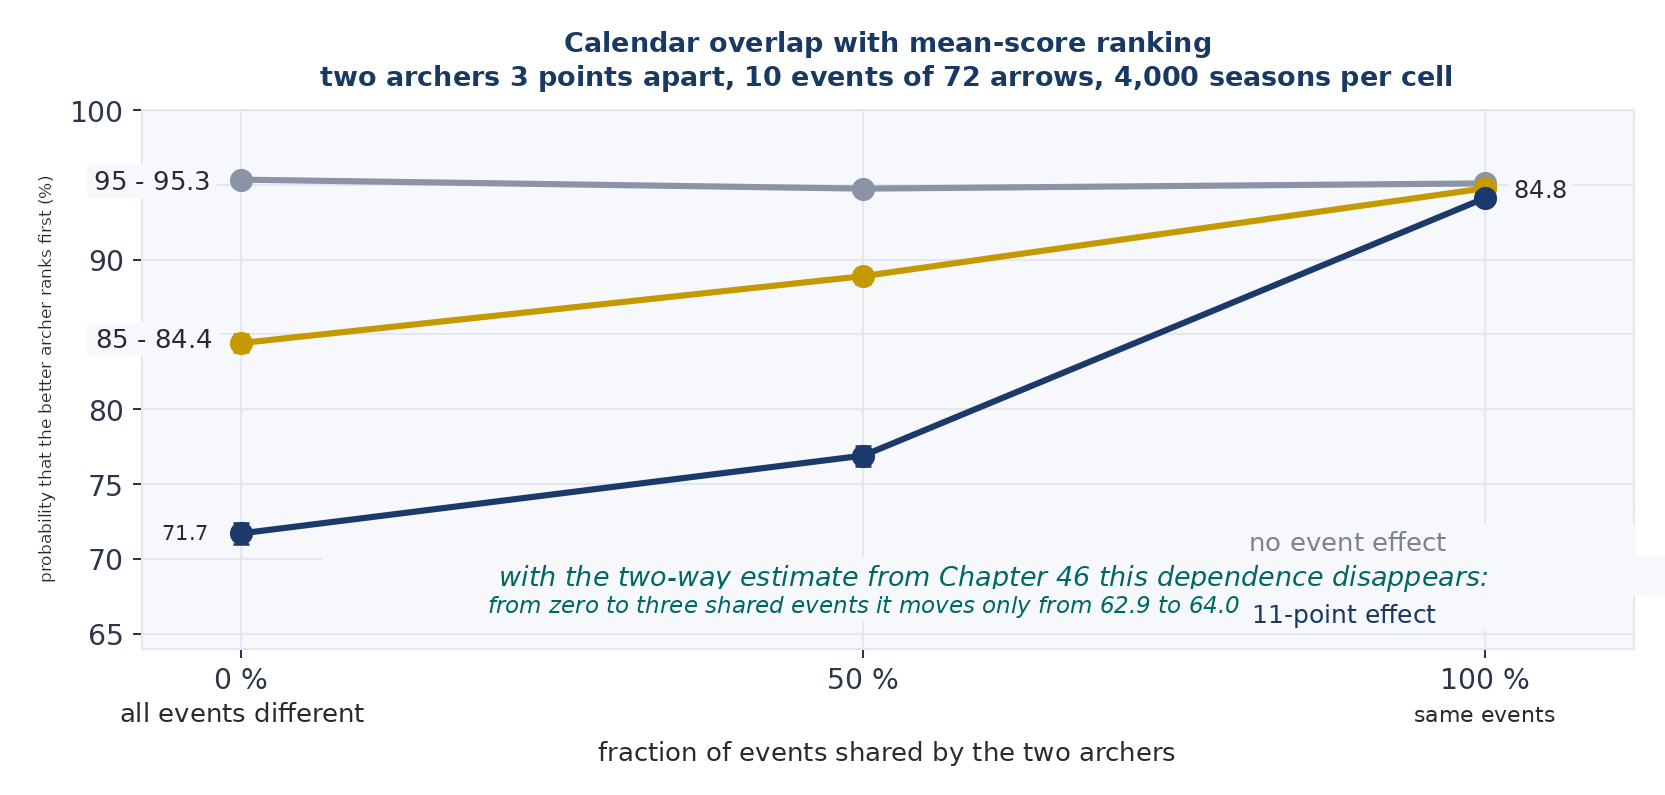
Figure 16. The overlap of calendars, with the ranking based on the mean of the scores. The better archer comes out on top, as a function of the fraction of shared competitions and for three magnitudes of the competition effect. Two archers 3 points apart, 10 competitions of 72 arrows, anchor level 700, 4,000 seasons per cell. With the joint estimation of chapter 46 the dependence is no longer visible among connected calendars.
46. The procedure, step by step
Here is the instrument, specified so that anybody can implement it.
The starting point is a single idea, and it is stated in words before symbols: an archer’s score at a competition is his level, plus the difficulty of that competition, plus whatever is left over. The level is what we want to estimate; the difficulty is the same for everyone present; what is left over is the individual’s good or bad day. In symbols, y_ij = μ + a_i + e_j + ε_ij. Everything that follows serves to recover the levels and the difficulties from that.
The first step gathers the observations. Every archer–competition pair actually shot is lined up: an archer who has shot six competitions out of ten contributes six rows, not ten. Absences are not filled in and not averaged over; they simply are not there. And it is this that makes the rest delicate: if the calendars were all the same almost any procedure would work, and it is because they are not that the next step has to be done in one particular way.
The second step estimates the archers’ levels and the competitions’ difficulties together. Not the former first and the latter afterwards: together, seeking the values that minimise the overall discrepancy between predicted and observed scores, across all the rows gathered.
An anchor is needed, because adding a constant to every level and subtracting it from every difficulty would leave the predictions identical. The natural anchor is that the difficulties sum to zero, and with that the solution is unique. The difficulty of a competition then becomes a number of points that reads on its own: minus five means that competition cost five points to everyone who shot it.
That the two sets have to be estimated together is not an implementation detail, and it is the point at which a procedure can go wrong without anybody noticing. The route that comes to mind first — centring each archer on his own mean and then averaging the residuals by competition — appears to do the same thing and does not: it subtracts from each archer the mean of the difficulties of his own calendar, and if the calendars differ that constant is not common. It is not an error that attenuates with more data. An example is easily constructed with five archers, five competitions, no noise and everyone connected to everyone else, in which that procedure puts a 698 archer ahead of a 700 archer, while the joint estimation recovers the exact order.
The third step shrinks towards the mean. The estimate for an archer who has shot two competitions is not to be believed as much as that of one who has shot ten, and the remedy is to pull each one towards the general mean by an amount depending on how many competitions lie behind it. An archer who has shot a lot stays almost where he is; one who has shot little is drawn back towards the centre, because his number owes more to chance. With equal appearances the shrinkage is the same for everyone and the order does not change; with unequal appearances it does exactly the job one expects.
Four checks an implementation has to pass
They are not optional, because each intercepts a fault that would let through a perfectly reasonable-looking ranking.
The first verifies that all the archers are connected to each other, and it has to be done before estimating anything. If the group splits into two halves with no competition in common, the difference between the two is not in the data: the archers of one are not comparable with those of the other except by adding an assumption. An implementation that does not check for this produces a normal-looking ranking in which two halves are aligned by convention and not by measurement, and it is the only check that intercepts that error.
The second tests the two possible manipulations separately, because an archer can cheat in two opposite ways: by shooting as many competitions as possible, or by selecting only the best ones. At fixed appearances the two coincide, so a single check appears to verify both and does not.
The third verifies that the naive methods really do turn out to be manipulable: the sum of the scores and the simple mean must fail, and if they do not fail it is the check that is broken.
The fourth compares the joint estimation with the two-stage one, on a case with no noise and with unbalanced calendars. They must give different results, and the joint one must recover the true levels. If they coincide, the anchor is not acting and the estimate is not what one believes it to be.
47. One example worked through in full
Five archers, 5 competitions, partial attendance. The scores are invented but the mechanism is the real one, and at the end we shall compare the result with the truth I used to construct them. The case is built around a real problem: Charlie skipped the two hard competitions, Bravo shot them all.
| comp. 1 | comp. 2 | comp. 3 | comp. 4 | comp. 5 | mean | comps. | |
|---|---|---|---|---|---|---|---|
| Alfa | 697 | 683 | 699 | 679 | 691 | 689.8 | 5% |
| Bravo | 691 | 677 | 691 | 679 | 682 | 684.0 | 5% |
| Charlie | 694 | — | 687 | — | 686 | 689.0 | 3 |
| Delta | 685 | 666 | 684 | 671 | — | 676.5 | 4 |
| Echo | — | 662 | 679 | 667 | 673 | 670.2 | 4 |
(Constructed example: the scores are generated from known true levels and known competition difficulties, which we shall reveal at the end in order to verify what the procedure managed to recover.)
Looking at the raw means, Charlie is second with 689.0, a whisker behind Alpha and five points above Bravo. But Charlie skipped competitions two and four, and the question is whether those two were harder than the others.
Estimating each archer’s level and each competition’s difficulty together, with the anchor that the difficulties sum to zero, gives this.
| comp. 1 | comp. 2 | comp. 3 | comp. 4 | comp. 5 | |
|---|---|---|---|---|---|
| Estimated difficulty | +8.2 | −8.7 | +6.7 | +6.7 | +0.5 |
Competitions two and four were hard — they take eight and six points off everyone who took part — and competitions one and three were easy. Which is to say: exactly what Charlie avoided.
Correcting the scores and shrinking gives the final ranking.
| Raw mean | Position | After correction | Position | True level | |
|---|---|---|---|---|---|
| Alfa | 689.8 | 1st | 689.6 | 1st | 690 |
| Charlie | 689.0 | 2nd | 683.8 | 2nd | 682 |
| Bravo | 684.0 | 3rd | 683.9 | 3rd | 686 |
| Delta | 676.5 | 4th | 676.8 | 4th | 678 |
| Echo | 670.2 | 5th | 672.6 | 5th | 674 |
(Same example. The right-hand column is the true level used to generate the scores, and serves only to check the result: in a real season it is not observable. The corrected values are rounded to one decimal place: Bravo’s margin over Charlie is 0.15 points, which the table shows as 683.9 against 683.8.)
Here is what the procedure did. On the raw mean Charlie stood five points above Bravo purely by virtue of having skipped the two hard competitions; after the correction his advantage falls to four tenths of a point. The procedure recovered almost all of the undue advantage — five points stolen from the calendar, four point six given back.
And now the part that matters most, which is why I chose this example instead of one that worked better. Bravo’s margin over Charlie is fifteen hundredths of a point, and the table in chapter 49 says that with 5 competitions three points of margin are needed to identify the better archer eighty-five per cent of the time. One and a half tenths of a point separates nothing: the procedure is saying that Charlie and Bravo are indistinguishable, and that is the correct answer, because in truth Bravo is four points better and the ranking still has the order wrong.
The example therefore shows two things at once. The procedure does its job, because it removes the undue advantage of an archer who chose the easy competitions, and the four tenths against five points is the measure of how much work it did. And it does not work miracles, because with 5 competitions and archers four points apart the order remains uncertain, and that is exactly what the ranking has to say. Not “Charlie is second”, but “Charlie and Bravo are four tenths apart, that is, not separated”. Chapter 50 says what to do about it.
48. The problem no amount of data solves
There remains the structural defect of every sporting ranking, and it is the one on which this part has to say something new or not be worth doing: athletes choose which competitions to enter, and the missing competitions are not missing at random. You skip a competition when you are out of form, you go to the one that suits you, you avoid the one with the difficult field.
Worse, a ranking that can be manipulated by choosing one’s calendar is a non-starter. If it pays to shoot little and well, the award stops measuring accuracy and starts measuring cunning in scheduling.
The requirement can, however, be converted into an experiment, and that is what makes this chapter useful rather than a caution. Take a simulated archer, give him the freedom to choose his competitions so as to finish as high as possible, compute the best strategy and measure how many places he gains.
Which archer is allowed to manoeuvre matters, and the choice has to be declared. The manipulating archer is the sixteenth of thirty-two, that is, a mid-table archer, and it is the position from which most is to be gained: an archer already first would have nothing to manoeuvre, and one who was last would not get high up in any case. The baseline is six competitions chosen at random out of ten, and the number that follows is the worst case among the positions tested, not the typical one.
| Ranking method | Position without cheating | Shooting every competition | Choosing the best |
|---|---|---|---|
| Sum of the scores | 16.0 | 1.00 (+15.0) | 10.85 (+5.2) |
| Mean of the scores | 16.0 | 16.04 (+0.0) | 10.84 (+5.2) |
| Joint estimation of chapter 46 | 16.1 | 16.03 (+0.0) | 15.16 (+0.9) |
(Sixteenth archer of 32, season of 10 competitions, baseline six competitions at random. 600 seasons for the first column and 500 for the second, in paired comparison.)
The first row is the one that should close the question of summing scores for good. A mid-table archer goes from sixteenth to first place simply by entering every competition instead of six: fifteen places, without shooting a single arrow better than before. Whoever wins that ranking is whoever enters most often.
And the two manipulations are opposite and mirror-image, which is the thing to understand: the sum rewards whoever shoots more and does not reward skipping bad days, the mean does exactly the reverse. The three methods therefore do not lie on a scale of quality, they lie on two axes, and a comparison on one manipulation alone orders them badly — which is what anybody would do by testing only the manipulation that occurs to them.
Only the joint estimation withstands both. And not entirely: nine tenths of a place, which should be reported and not rounded to zero. An archer who chooses his competitions well gains less than one place, where with the mean he would gain five.
The shrinkage removes the competition effect but not completely, because that effect is estimated from the very data the archer has chosen to produce: without assumptions about how he chooses, no procedure that learns from observed data alone can be guaranteed immune to somebody who decides which data to produce. And the manipulation that remains is precisely the one actually observed in sport: nobody shoots badly on purpose, plenty of people skip a competition when they do not feel in form.
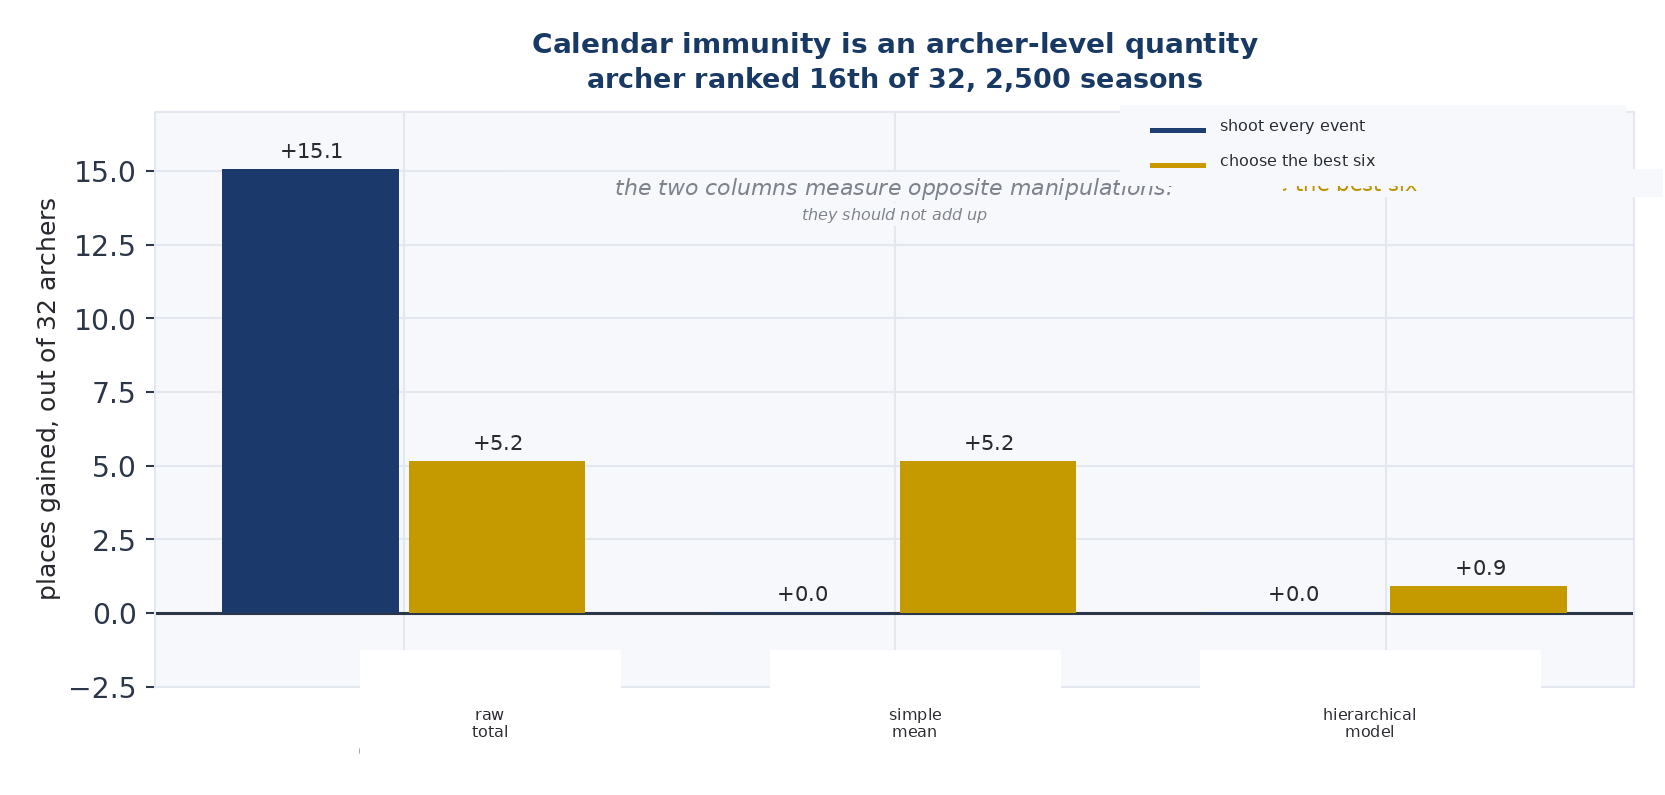
Figure 17. Immunity to the calendar is a quantity. Places gained by an archer sixteenth of 32, in a field of 32 athletes between 700 and 660, who chooses his calendar strategically, for two opposite manipulations. 2,500 seasons, in paired comparison. The two columns measure different manipulations and are not to be added.
49. Who enters the ranking, and when the award is individual
This is the part a federation would apply first, and it comes to two rules that can be written into a rulebook.
The first concerns when an individual award is defensible. The practical question is not how accurate the ranking is in general, but whether this first place, with this margin, holds up.
| Competitions shot | Margin 1 point | Margin 2 points | Margin 3 points | Margin 5 points |
|---|---|---|---|---|
| 5% | 72% [70–73] (60.3%) | 79% [77–81] (33.4%) | 85% [83–87] (15.8%) | 85% [77–91] (1.7%) |
| 10% | 85% [84–86] (58.1%) | 91% [90–93] (27.4%) | 95% [93–96] (10.1%) | 100% [86–100] (0.4%) |
| 20% | 95% [94–95] (58.3%) | 98% [98–99] (23.4%) | 100% [98–100] (5.2%) | 100% [21–100] (0.0%) |
(Probability that the first archer in the ranking really is the best in the field, given the observed margin over the second, with the 95 per cent Wilson interval in square brackets. In round brackets, how often that margin occurs. It is the question the award poses: not whether the first is better than the second, but whether he is the best of all. 32 athletes between 700 and 660, full calendars, joint estimation, 6,000 seasons per row. The interval shows how little a hundred per cent means on few cases: with twenty-one seasons above five points of margin it is “between 85 and 100”, with three seasons “between 44 and 100”.)
Which margin suffices is not decided by mathematics: it depends on how much certainty is wanted, and that is a choice for the federation. The arithmetic says this.
With ten competitions, one point of margin gives 85 per cent, that is, awarding the prize on a single point of advantage gets it wrong once in six, and over thirty years of prizes that is four or five given to the wrong person. Two points give 91, three give 95. If the threshold considered sufficient is ninety-five per cent, then with ten competitions three points are needed and not two; if it is ninety, two suffice; with twenty competitions two points already give 98.5.
The values in round brackets are what make the rule adoptable rather than theoretical, and they are the reason I computed them. At ten competitions, a margin of two points occurs in a little over one season in four, and one of three points in one in ten. Raising the certainty threshold costs in frequency: the surer one wants to be, the more rarely the award can be given.
So with the threshold at two points the individual award is given one year in four, and in the other three the honest form is collective. A federation knows what frequency to expect before adopting the rule, instead of discovering it in the third season, and that is the difference between a rule that can be discussed and one that is simply endured.
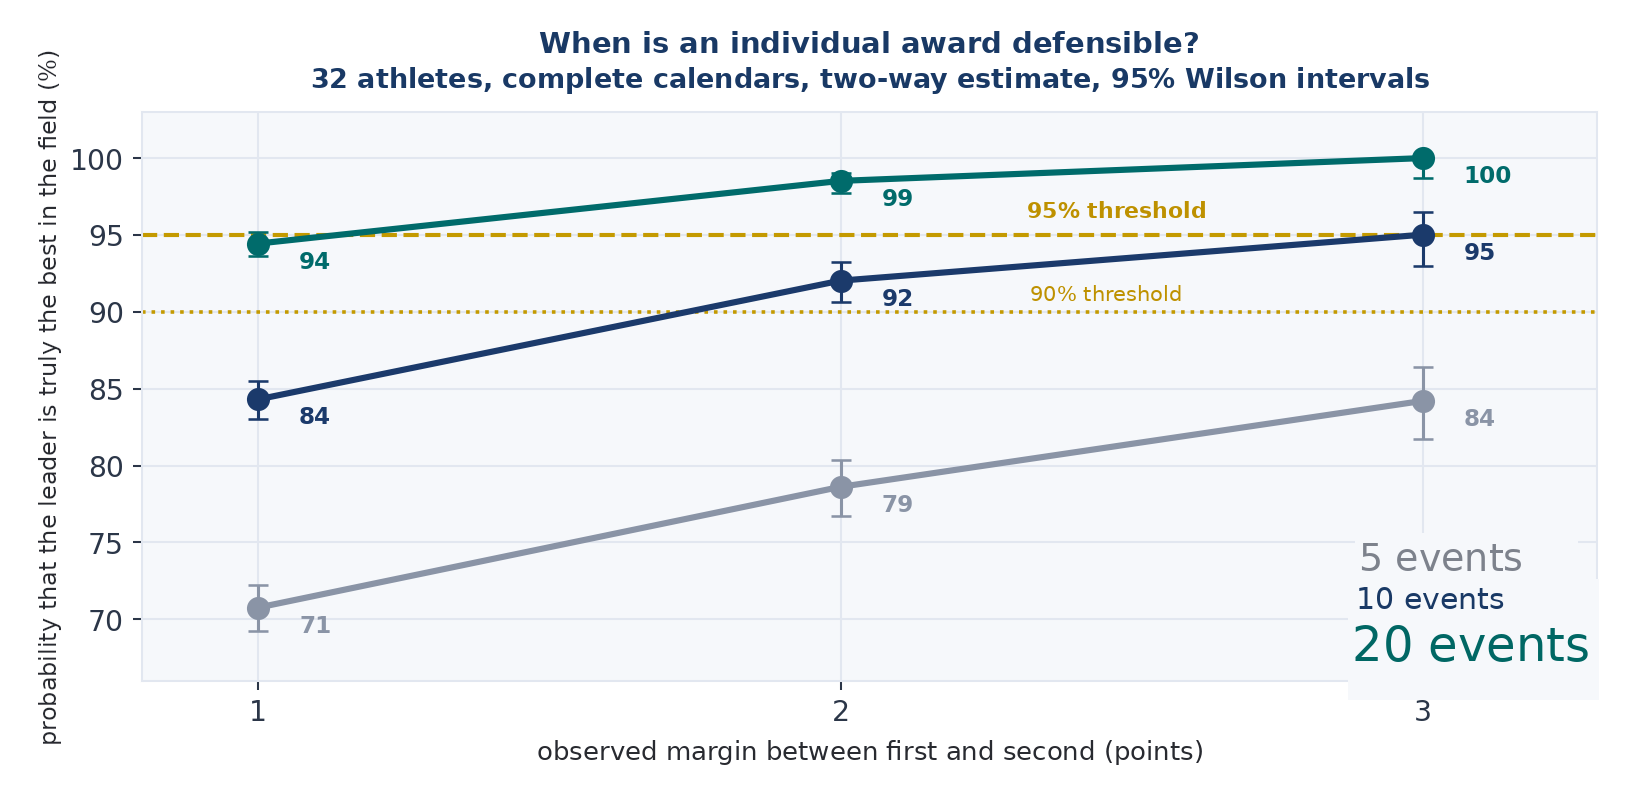
Figure 18. When an individual award is defensible. Probability that the first archer in the ranking really is the best in the field, as a function of the observed margin over the second and the number of competitions. 32 athletes, full calendars, joint estimation.
The second rule concerns how many competitions are needed as a minimum to enter the ranking.
| Threshold | Places gainable by manipulating |
|---|---|
| 3 competitions out of 10 | 1.19 |
| 5 | 0.79 |
| 6 competitions | +0.63 |
| 8 competitions | +0.00 |
| 10 | +0.00 |
(Sixteenth archer of 32, 1,500 simulated seasons per threshold.)
Manipulability falls continuously and reaches zero when the threshold exceeds typical attendance, because at that point skipping a competition means dropping out of the ranking, and the cost of manipulation becomes infinite.
But the zero is bought by excluding athletes, and it is a cost no accuracy table contains: a threshold of eight competitions out of ten excludes anyone who gets injured, anyone with work commitments, anyone living far from the venues. Six out of ten is the point at which the curve has already flattened without paying that price: between six and eight, six tenths of a place are bought and a whole category of athletes is lost.
And the awkward thing is worth saying: a ranking perfectly immune to manipulation is a ranking in which taking part is compulsory. Total immunity and accessibility are in conflict by construction, and anyone demanding the first is demanding the second without knowing it.
The two rules are drafted as follows.
Article — Seasonal ranking and annual award
1. The seasonal ranking shall be computed over all competitions on the official calendar shot during the year, in accordance with the procedure set out in the technical annex.
2. An athlete shall enter the ranking having shot at least 60 per cent of the competitions on the calendar, with a minimum of four.
3. Alongside each position there shall be published the estimated value, the margin over the following athlete and the number of competitions shot.
4. The federation shall declare in advance the certainty required for an individual award, and shall derive the corresponding margin from the table in chapter 49: with ten competitions on the calendar, two points for ninety per cent and three for ninety-five. The athlete of the year award shall be given individually if the margin of the first over the second reaches that threshold; otherwise it shall be given collectively to the athletes lying less than that threshold behind the first.
5. The ranking shall be updated after each competition on the calendar and shall be publicly available.
The third paragraph is what makes the rule verifiable and is its most important part: by publishing the margin, anybody can check for themselves whether first place is defensible, whereas without that figure the rule in the fourth paragraph would be a decision taken elsewhere. The fifth serves Part Two, because if the ranking is to compose the brackets it has to be updated and public before every competition.
50. What really matters in a calendar
If the procedure of chapter 46 reduces dependence on the calendar almost to zero, it remains to be asked whether the calendar still matters. The answer is yes, but not for the reason one would expect.
The six calendars compared are constructed as follows, over thirty-two athletes and twelve competitions with six appearances each. In the disjoint blocks the first sixteen shoot competitions one to six and the other sixteen seven to twelve, never meeting. In the calendars with competitions in common, one, two or three competitions are compulsory for everyone and the rest are drawn within one’s own block. In the free draw each athlete draws six competitions from twelve with no constraints, and this is the realistic case. In the balanced draw the drawing is the same, but with exactly sixteen participants per competition — this serves to separate the effect of the structure from that of the imbalance in attendance.
| Calendar | Competitions in common, minimum | The first is the best |
|---|---|---|
| two disjoint blocks | 0 | 63.2% |
| one competition in common | 1% | 64.5% |
| two competitions in common | 2% | 64.6% |
| three competitions in common | 3 | 64.6% |
| balanced draw | 0 | 63.0 |
| free draw | 1% | 63.8% |
(32 athletes between 700 and 660, 12 competitions of 72 arrows, 6 appearances each, normal competition effect with a standard deviation of 11 points, 12,000 paired seasons for all designs. As with the table in chapter 52, the levels depend on the magnitude assumed for the competition effect, while the direction of the comparison survives reparameterisation.)
One thing has to be distinguished from another, because they are two different questions, and the first row is a case apart. With two blocks sharing no competition the two groups are not connected, and the difference between them is not in the data: the number that comes out depends on how that indeterminacy is closed, not on how well the procedure works. That row does not belong on the same scale as the others.
The other five are comparable, and they say this: sharing even a single competition is worth seven tenths of a point over the free draw, sharing two eight tenths and three eight tenths, with an error of five tenths on each: the three are not distinguishable from one another. It is not the block structure in itself that buys accuracy.
The reason is the pairing between the contenders, and it is subtler than it seems. In a block calendar the best archers all shoot the same competitions, so the comparison among the candidates for first place is perfectly paired: the wind and the light cancel out precisely in the comparison that decides the ranking. In the draw, by contrast, the best athlete shares only half of his competitions with each rival, and part of the comparison goes by an indirect route.
The check confirms it on the same run. Requiring only the eight candidates for the top to shoot the same six competitions (leaving the other twenty-four free to draw) is worth eight tenths of a point; pairing sixteen of them, 0.7; pairing all thirty-two, 0.8. The three contrasts each carry an error of five tenths, so the direction is always the same but this run does not separate the magnitude from zero, and the three are not distinguishable from one another.
And this is the design criterion for a calendar, and for a federation it is good news: it is not necessary that everybody meet everybody, it is necessary that the contenders meet. Six competitions shared among the eight candidates for the top is the configuration tested, and the rest of the calendar can be drawn by lot. The sign of the gain is consistent across all the measurements, but it is 0.8 points with an error of 0.6: it is not separated from zero, and six is not a demonstrated sufficiency threshold. It is a far cheaper recommendation than “everybody at everything”, because it requires compelling nobody.
Who those eight are matters, because that is the difference between a theoretical recommendation and an applicable one. In the first measurement they are the true best eight, whom no federation knows in advance: it is the upper bound for a perfect selection. Redoing the experiment with the eight chosen from the previous season’s ranking (the information a federation actually has), the result does not change: 64.5 with the true best eight, 64.6 with those chosen from the ranking, a difference of less than a tenth against an error of four tenths on each of the two. The recommendation is therefore adoptable, and this is measured and not assumed.
How many competitions in common are enough I measured by having the eight share from zero to six, keeping everything else identical. With one or two competitions in common nothing is measured: the gains are three and a half tenths and three tenths, within an error of three tenths. With three the signal is there: nine tenths, three times the error. From there on the grid does not rise in an orderly way — six tenths with four competitions, seven tenths with five, one point four with six — and the distance between one point and the next remains of the order of the error. Six is the maximum among those tested, not a demonstrated threshold. Higher values tend to appear as the number of shared competitions increases, but this simulation demonstrates neither monotonic growth nor a saturation threshold.
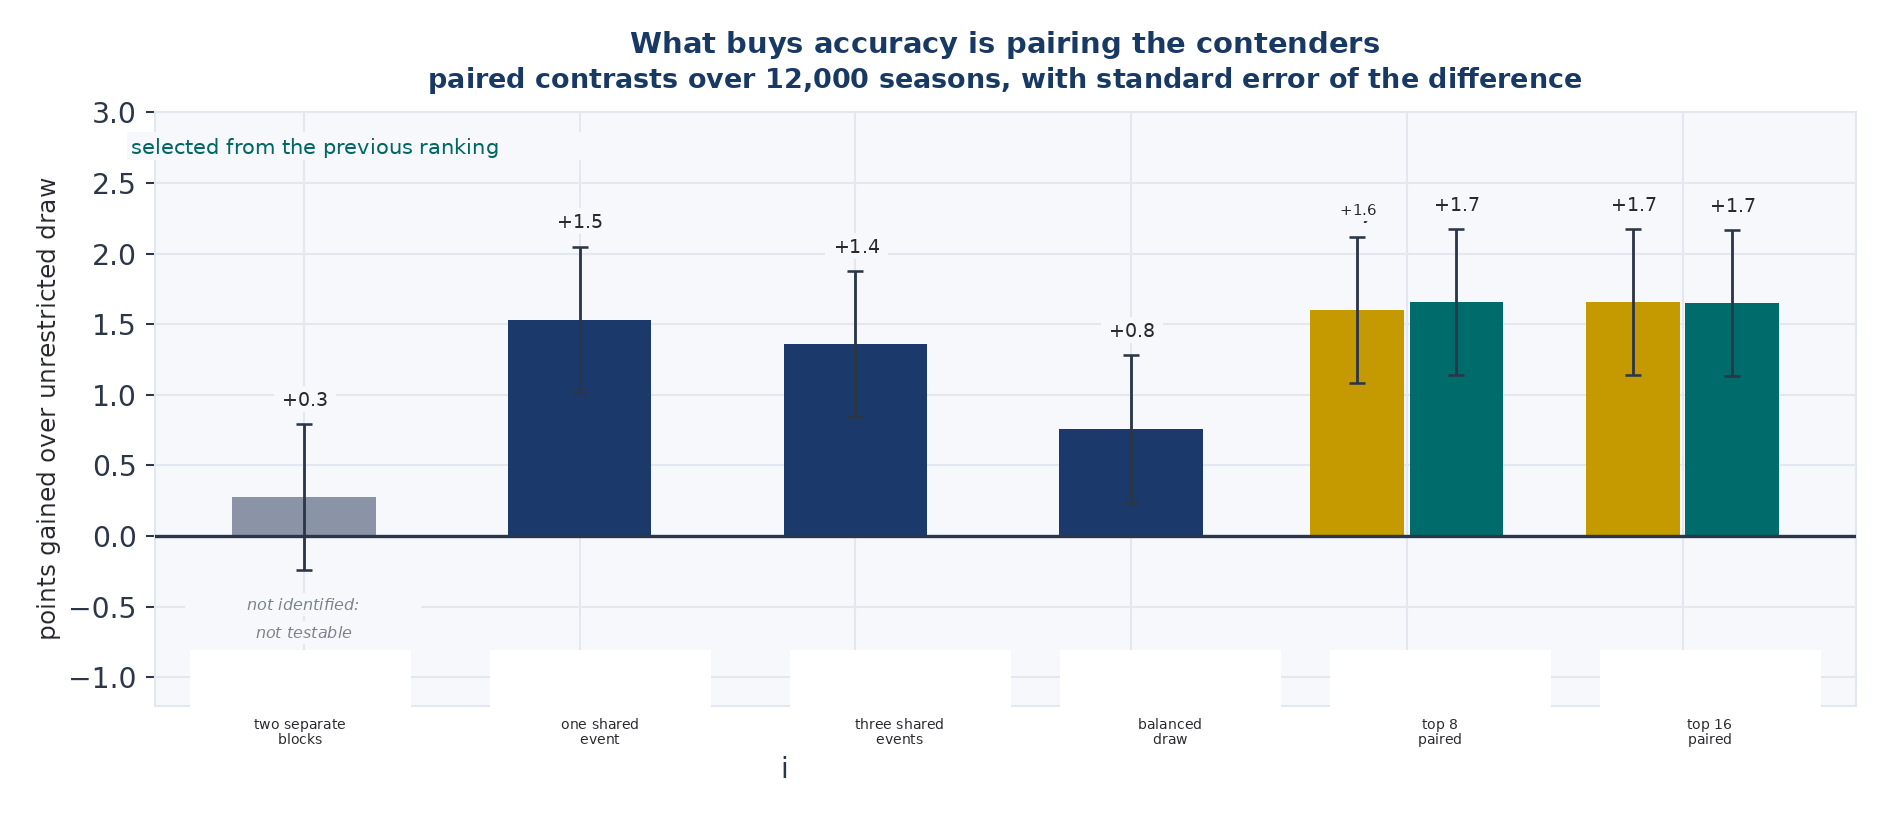
Figure 19 — What buys accuracy is the pairing between contenders, not the structure of the calendar in itself. Points gained over the free draw, measured as a paired contrast season by season, with the error of the difference. The green bars are the selection made in advance: the contenders chosen from the previous year’s ranking, that is, the information a federation actually has. The first column is not identified and is not to be compared with the others. 32 athletes, 12 competitions, 6 appearances each, 12,000 seasons, joint estimation.
51. How much data is needed
This is the piece that makes the instrument adoptable, because a federation has to be able to know in advance how much data it needs instead of discovering it afterwards.
| comps. | 36 arrows each | 72 arrows each | 144 arrows each |
|---|---|---|---|
| first / top three | first / top three | first / top three | |
| 5% | 52.0 / 34.3 | 61.5 / 50.1 | 72.8 / 67.6 |
| 10% | 62.1 / 50.6 | 71.5 / 67.2 | 82.8 / 81.8 |
| 20% | 73.0 / 68.5 | 83.7 / 82.3 | 92.2 / 91.1 |
| 40 | 83.4 / 80.6 | 92.4 / 90.5 | 97.9 / 96.8 |
(Probability of placing the first archer correctly, and of identifying the top three correctly as a set. Full calendars, joint estimation of chapter 46, 32 athletes between 700 and 660, 3,000 seasons per cell.)
The cell to look at is the one for the typical calendar: ten competitions of 72 arrows, which is what a national federation offers. The first archer in the ranking really is the best 71.5 times in a hundred, that is, it gets three seasons in ten wrong. It is far better than a tournament title, which gets it wrong nine times in ten, and it remains a long way from certainty.
To get past ninety per cent, within the grid tested, twenty competitions of 144 arrows are needed, or forty of 72. The two routes cost the same, because both come to 2,880 arrows per athlete against today’s 720: four times the current commitment, that is, four of today’s seasons compressed into one. I do not claim they are the minimum combinations; I claim they are the cheapest among those tested.
The two levers are not separated by this grid. Doubling the competitions takes it from 71.5 to 83.7, doubling the arrows takes it from 71.5 to 82.8, and the two destinations are one point apart with an error of one point. That is not a proof that they are worth the same: to say so one would have to fix in advance how small a difference has to be to call it null, and check that the interval fits inside it. Put practically, between twenty competitions of 72 arrows and ten of 144 the simulation does not separate, so the choice between the two should be made on cost and calendar, not on accuracy. What does matter is who shoots them alongside whom, as the previous chapter showed.
And there is a fact worth looking at: the gap between identifying the first archer and identifying the top three closes almost entirely as the data grow.
At five competitions of 36 arrows the first comes out right in 52 per cent of cases and the trio in 34: eighteen points apart. With a short season, therefore, awarding a podium is far harder than awarding a winner, and a federation handing out three prizes gets at least one of them wrong two times in three. At forty competitions of 144 arrows the first is worth 97.9 and the trio 96.8: one point apart, which with this run’s error is indistinguishable from zero.
That the two questions cost exactly the same I do not demonstrate, and the difference between the two statements is the difference between not having found a difference and having found an equality. The trio remains the harder problem in all twelve cells and never overtakes. What changes with the data is not which of the two questions is easier, but how much the choice between them weighs: with little data it weighs a great deal, with a lot it barely weighs at all.
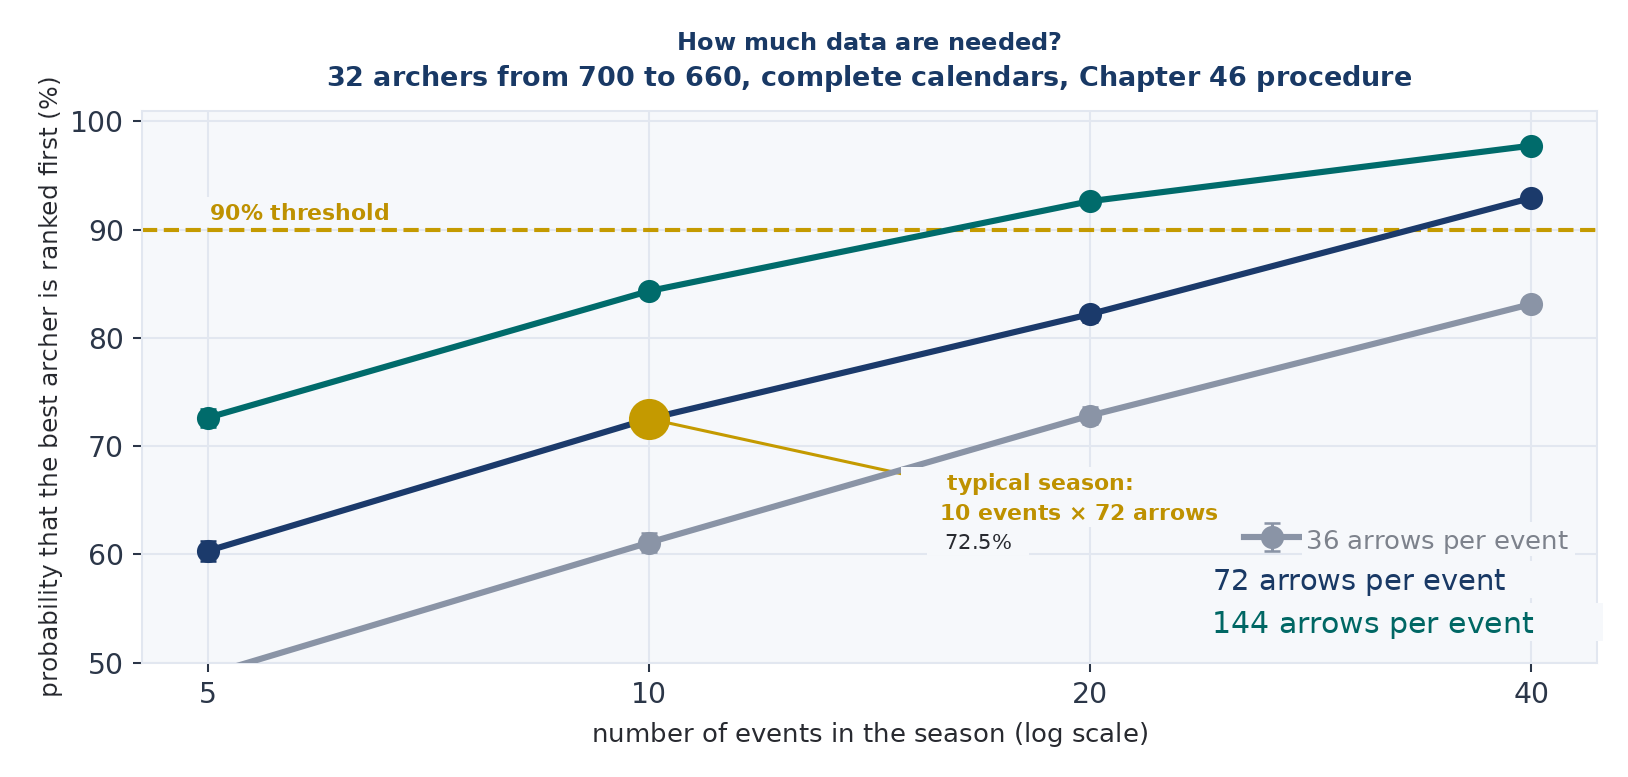
Figure 20. How much data is needed. Probability of placing the first archer correctly, by number of competitions and arrows per competition. Full calendars, 32 athletes between 700 and 660. Logarithmic scale; the typical season highlighted.
52. The final comparison: what a season is worth
And here at last is the quantity to set alongside the tournament’s ten per cent.
| With partial calendars | With full calendars | |
|---|---|---|
| Points table by placing | 33.0% | 72.7% |
| Sum of the scores | 16.4% | 73.0% |
| Mean of the scores | 37.1% | 72.8% |
| Joint estimation of chapter 46 | 58.6% | 73.0% |
(Probability that the first archer in the ranking really is the best. 32 athletes between 700 and 660 — hence 1.3 points between neighbours in the ranking — 10 competitions of 72 arrows, normal competition effect with a standard deviation of 11 points, 4,000 seasons. In the partial calendars each athlete shoots a number of competitions drawn between three and seven.)
A note on how solid these four numbers are, because it is different from the rest of the volume. The levels depend on how large the competition effect is assumed to be, which is a declared and not a measured value: redoing the calculation with a somewhat different assumption moves the first column by a couple of points and the second by one. The distances between the rows, however, do not move: with full calendars the four methods stay within 1.8 points, and with partial calendars the joint estimation stays 21.5 points above the simple mean and 25.6 above the points table. What one takes away from this table is the distances, not the levels.
With full calendars the four methods are close together, between 72.7 and 73.0: the space between reasonable methods is three tenths of a point wide, and the choice of method decides almost nothing — just as the tie rule and the match format decided almost nothing.
With partial calendars it decides a great deal, and it is the only place in the volume where the choice of method is worth more than the structure. Between the best and the worst of the four there are forty-two points.
But what separates them is not the quality of the method: it is how far each withstands the fact that not everyone shoots the same competitions. The sum of the scores collapses to 16.4 per cent (that is, it gets first place wrong five times out of six) because it rewards whoever has shot most. The points table does not do much better, because it too accumulates. The simple mean holds up rather better than the first two because it normalises. And the joint estimation stands above them all at 58.6 because it is the only one that treats attendance as a feature of the design rather than as merit.
And there is a third reading worth more than the other two. Completing the calendars is worth a great deal, and with a full calendar the choice of method hardly matters: going from partial to full calendars takes the joint estimation from 58.6 to 73.0, that is, fourteen points, and once they are full the four methods lie within three tenths. With partial calendars, by contrast, the method matters enormously (forty-two points between the best and the worst), and the two statements are to be kept distinct. Put in terms of seasons: with full calendars the ranking gets first place wrong two seasons in seven, with partial ones four in ten, and no refinement of the calculation recovers that difference.
The number to keep is this one: with 10 competitions and full calendars the first archer in the ranking really is the best three times out of four, against one time in ten for the title of a tournament as organised today, and one in seven with the best configuration of Part Two — remembering that the tournament is measured over 64 archers and the season over 32, so the two figures describe two scenarios and are not to be divided one by the other.
53. What to take away from Part Three
A season orders three points, not one. Ten competitions tell apart two archers three points out of 720 apart with a reliability of 95.3 per cent; to tell apart one point would take 85 competitions, that is, eight and a half seasons at a full calendar.
One score cannot be compared with another without correcting for the difficulty of the competition: ignoring this costs about twenty-two points in the scenario tested, and the joint estimation cancels them — among connected calendars no measurable dependence remains.
Immunity to the calendar is a quantity and it can be bought. With the sum of the scores a mid-table archer gains fifteen places by choosing where to shoot; with the correct procedure he gains less than one. Total immunity costs the exclusion of those who cannot be there.
The award is individual above a margin declared in advance and collective below it. With ten competitions, two points of margin give ninety per cent certainty and occur a little more than one season in four; three points give ninety-five and occur one in ten. What certainty is required is decided by whoever gives the award, not by this arithmetic.
And the calendar matters for two things. The first is a requirement: all the archers have to be connected to each other by shared competitions, otherwise the levels of two separate groups are not comparable. The second, given that requirement, is that the contenders for the top should shoot the same competitions.
Everything in this volume rests on one sentence I have never put to the test. I have described every archer with a single number — how scattered his arrows are about the centre — and from that I have derived the probability of every ring, of every score, of every match. Assuming that number is enough means assuming that impacts are distributed like a Gaussian: a symmetric group thinning out regularly as one moves away from the centre.
It is a convenient assumption, and there is empirical evidence in its favour. Dall and Park, using over two hundred thousand arrows, find that distance from the centre follows very closely the form a round Gaussian group produces, and that the same form holds for compound and recurve, men and women, indoors and outdoors, from intermediate level to elite.
What a good overall fit does not rule out is the tails. Anyone who shoots knows that an archer does not always miss in the same way: most arrows sit in a tight group, and every so often one leaves that has nothing to do with that group — a snatched release, a gust misjudged, a lapse of attention at the wrong instant. If those arrows exist and are not extremely rare, the group is no longer a Gaussian: it is a tight core plus a scattered minority.
This chapter asks what happens to the volume’s conclusions if the world is made that way. It does not replace the model: it places it inside a wider family and tries to break every result I have obtained.
The model, and what it does not claim
Every impact comes from one of two components. Almost always from the core; every so often — call that frequency ε — from a component of the same shape but wider by a factor I call the severity. With ε equal to zero the volume’s model is recovered exactly, and not by resemblance: the calibration returns the same spread to the tenth digit, and it is one of the tests the apparatus runs at every reconstruction (formulas S22 and S23).
An archer is no longer one number but a profile of three: how tight the core is, how often an out-of-pattern shot arrives, and how severe it is when it does.
Let me say at once what this chapter does not do. It does not claim that any particular percentage of anomalous arrows describes real archers. None of the values of ε I shall use is estimated from scorecards: they are scenarios. The question I answer is more modest and more useful: which conclusions hold across a whole class of distributions, and which, by contrast, depend on the shape of the tails. The thing to ask is not what ε is worth: it is what it would have to be worth to make me wrong.
Why the question is not idle
The first calculation is the one that made all the rest necessary. I took a 690-point archer and reconstructed him under every combination of frequency and severity, calibrating the core each time so that the expected score remained exactly 690. All these archers are worth the same; only how they get there changes.
That is not the only thing that changes. The dispersion of the round score — how much an archer fluctuates from one competition to another — goes from 4.58 points in the Gaussian model to 5.71 when five arrows in a hundred come from a component with triple the deviation, and to 7.47 when ten arrows in a hundred come from one with quadruple.
To make it concrete: in the Gaussian world a 690 archer fluctuates by four and a half points from one competition to the next; in the last case by seven and a half. He is an archer who looks far less reliable while having the same mean.
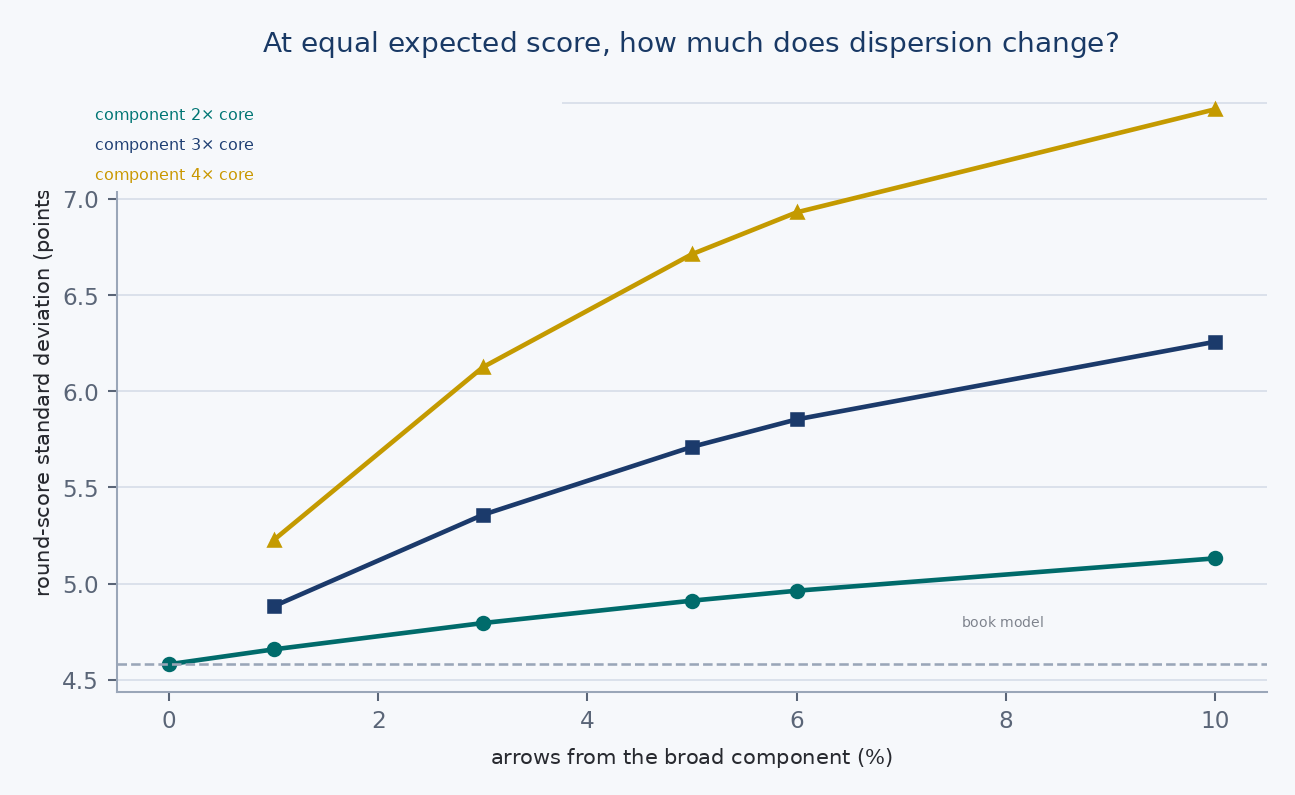
Figure 21 — The dispersion of the score under contamination. Standard deviation of the round score for a 690 archer, as the frequency and severity of out-of-pattern arrows vary. At zero frequency the volume’s model is recovered.
And the dispersion of the score is the quantity on which half this book rests: how often two archers end level, the reliability of the shoot-off, that of the match total, the precision of the season estimate. If it changes by over sixty per cent, it cannot be taken for granted that the conclusions stay where they are.
The matches hold, and the reason is instructive
The first experiment seemed to give a strong result, and it turned out to be wrong. I recount it because the way it fell says something about the problem.
I took two archers with the same expected score: the first regular, with a wide core and almost no anomalous arrows; the second more precise but fragile, with a tight core and five arrows in a hundred out of pattern. I had them meet two hundred thousand times under four systems. The set system rewarded the fragile archer by three and a half points, five times more than the cumulative total: it looked as though the formats weighted ordinary accuracy and risk of failure differently.
Then I matched the dispersion as well. With the same expected score and the same fluctuation from competition to competition the effect almost disappears: across every system tested the departure from fifty per cent lies within three tenths of a point. For the shoot-off arrow the probability can be computed exactly, without simulating, and it is 49.7497 per cent: the departure from level is 0.2503 points, that is, over a thousand shoot-offs the fragile archer loses two and a half more than the regular one.
On this family of distributions, then, almost all the fragile archer’s advantage came from the dispersion and not from the shape.
It would be improper to conclude that at equal mean and fluctuation the tails never matter. That is not true, and one example is enough to show it. Take A, who scores 2 points seven times in ten and 4 points three times in ten; and B, who scores 0 points once in ten, 2 points once in ten and 3 points eight times in ten. They have the same mean, 2.6, and the same fluctuation — the variance is 0.84 for both; and yet in a direct comparison A wins 40.5 times in a hundred and B 59.5. The two summary numbers do not determine who wins, because winning is not a linear function of the score.
What this chapter’s calculation shows is that in the family of mixtures tested the residual effect of shape is small, not that it is null in general.
The tie rules do not hold
Part One compares fourteen ways of settling a match that has ended five-all and concludes that nine of them beat the one in force. The question that matters is not whether the numbers change — they all do — but whether the order changes, because it is the order a federation uses to choose.
Two things change, and they must be kept separate because they are measured on different matches. The tie-break rules are consulted on matches that have reached five-all; the ten count of chapter 14 is consulted on matches with level totals, and that is where it must be measured.
The first is the order of the fourteen methods. In the Gaussian model the weighted count followed by the arrow wins, guessing right 64.2 times in a hundred. It takes only one arrow in a hundred being out of pattern for TOTAL+ to move to the top; with three in a hundred CONCUR wins, with five the arrows below ten, with ten the ten count followed by Xs. The ranking has no stable leader: anyone choosing the best rule according to the Gaussian model would be choosing a different rule in each of those worlds.
The weighted count shows why. It is the rule built to extract the maximum information under the standard model, and it is the best as long as that model is true: it goes from 64.16 to 53.45 with five anomalous arrows in a hundred, and to 47.85 with ten, that is, below the draw. The weights that make it optimal become the wrong weights, and a rule tuned to a model is fragile exactly to the extent that it is efficient.
The second concerns the ten count, and it is more serious. Under the Gaussian it points to the wrong archer 55.6 times in a hundred — the result that gives chapter 14 its title and that I have used as an argument for half a volume. With three anomalous arrows in a hundred it guesses right 52.4 times in a hundred and has already stopped being worse than a coin toss; with five it is worth 55.5, with ten 63.9.
| Design | Tie rule | TOTAL+ | Cascade | Ten count |
|---|---|---|---|---|
| Gaussian | 56.94 | 63.06 | 59.93 | 44.45 |
| 3 | 57.09 | 59.80 | 58.84 | 52.44 |
| 5% | 56.51 | 58.62 | 58.77 | 55.54 |
| 10% | 56.08 | 54.92 | 56.75 | 63.85 |
(Table 21. How often each rule identifies the better archer, between a 690 archer and a 680 archer. The first three on the population of matches ending five-all, the ten count on that of level totals, which is the population on which chapter 14 examines it. Six hundred thousand simulated matches per cell, randomness paired across models.)
The mechanism is simple once seen, and it works both ways. An out-of-pattern arrow takes many points off the match total and a single ten off the ten count: whoever reads the total also reads the disaster, whoever counts tens does not. The total thus loses eight points in going from the Gaussian model to ten per cent tails; the ten count, on its own population, gains nineteen.
It is the mechanism of chapter 15 read backwards. There I had shown that at an equal total, having more tens means having concentrated the deficit on fewer arrows, and that the count therefore identifies whoever shot worse. That reasoning holds as long as the deficit is distributed as the Gaussian model predicts. If a minority of arrows comes from a wide component, the deficit of an archer who suffered one is concentrated for a different reason — not because he shot unevenly, but because he had an accident — and then having more tens goes back to meaning what intuition says: having shot better.
The anti-informativeness of the ten count is therefore a property of the model, not of the count.
How thorough the reversal is can be read from a single number: the coefficient of concordance between the ranking of the fourteen rules in the Gaussian world and the one in the contaminated world. It is 1 if the two rankings are identical, 0 if they are unrelated, and −1 if one is the exact reverse of the other. It goes from 0.76 with one anomalous arrow in a hundred to −0.56 with ten: the order does not degrade, it reverses. I repeated the result with five independent seeds and with five pairs of archers.
Above that threshold the rule I have criticised throughout the volume becomes competitive again, and for a reason that has to be granted it: it is blind to disaster, and in a world with disasters blindness protects.
A warning about direction, before reading the table. The scenarios contaminate the elite pair not because I believe anomalous arrows live mainly there: the contamination goes where the conclusions are. A robustness test puts the defect where it would do most harm, and the decisive conclusions of this part of the volume are concentrated in the elite domain, so it was above all that domain that had to be poisoned; testing the tails only on lower-level fields would have been an experiment with a lower stake for the question at issue here.
From that methodological choice, however, no thesis about the real world should be inferred. Indeed, if I had to make a prediction, I would bet on the opposite. My hypothesis is that a substantial share of out-of-pattern shooting reflects execution errors or disturbances, and that ability consists partly in the capacity to reduce their frequency: I therefore expect ε to fall as one moves up in level, and the departure from the regular core not necessarily to disappear even at elite level, but to be on average more pronounced at lower levels.
The compression of totals towards the limit of 720, by contrast, arises from the transformation of impacts into a bounded score and does not by itself constitute evidence about the shape of the dispersion group. It is a conjecture, and I leave it here deliberately so that it can be falsified. Were it confirmed by data, the table would have to be read accordingly: more severe contamination scenarios for lower-level fields and, for the elite, a narrower neighbourhood of the true value of ε — precisely in the region where this chapter’s breaking thresholds turn out to be lowest.
| Pair | 3 | 5% | 10% |
|---|---|---|---|
| 690-680 | 36 | 49 | 65 |
| 690-685 | 33 | 42 | 58 |
| 700-690 | 40 | 44 | 53 |
| 680-660 | 26 | 39 | 73 |
| 660-640 | 17 | 29 | 66 |
(Table 22. How many pairs of rules swap places in going from the Gaussian world to the contaminated one, for five pairs of archers. Among fourteen rules there are ninety-one possible pairs; counted here are those both runs distinguish with confidence.)
The elite pair is the most fragile — it breaks with as few as three anomalous arrows in a hundred — because at those levels the totals are compressed against the maximum of the round and an anomalous arrow weighs relatively more. The mid-level pairs hold up longer.
The tournament structures hold
Part Two concludes that the seeding matters more than the structure of the bracket. Here the robustness is clear-cut.
| Design | standard | Reseeding | Draw | paired |
|---|---|---|---|---|
| Gaussian | 15.55 | 17.82 | 14.69 | 14.51 |
| 1% | 15.81 | 17.48 | 14.48 | 14.01 |
| 3 | 15.14 | 16.98 | 13.18 | 13.64 |
| 5% | 14.59 | 16.38 | 13.13 | 13.32 |
(Table 23. How often the best archer in the field wins the tournament, out of a hundred tournaments, for each structure. Field of 64 archers, twelve thousand tournaments per cell, paired randomness.)
Read it by columns. Every structure falls together by about a point and a half in going from the Gaussian world to the one with five anomalous arrows in a hundred, and the distances between them stay the same. Reseeding stays first in every row, and there is not a single pair of structures that swaps places.
The reason, in the grid tested, is that a tournament aggregates sixty-three matches and aggregation levels out differences of shape: every structure loses discriminating power to the same extent, because the loss comes from the extra noise in the individual matches. It is a regularity observed on this grid of contaminations, not a theorem for every departure from the Gaussian.
Part Two’s conclusion is therefore the most solid of the three. If one had to choose a single intervention without knowing how the world is made, the one on the seeding is the only one that does not change sign.
The season is the fragile part
Here I made the most severe test I knew how to make. Instead of changing the way the data are generated and the way they are analysed together — which would answer the easy question, whether the right instrument works on the right data — I generated seasons from the contaminated world and analysed them with the procedure of chapter 46, the one the volume actually uses and which goes on believing in Gaussian errors.
| Design | identifies the best archer | error of the estimate | loss |
|---|---|---|---|
| Gaussian | 62.20% | 2.111 | — |
| 1% | 62.00% | 2.246 | negligible |
| 3 | 56.93% | 2.485 | like 2.0 fewer competitions |
| 5% | 55.97% | 2.638 | like 2.3 fewer competitions |
| ε = 5%, severity 16 | 50.93% | 3.083 | like 4.2 fewer competitions |
| 10% | 49.43% | 3.431 | like 4.7 fewer competitions |
(Table 24. The procedure of chapter 46 applied to seasons generated from the contaminated model. Thirty-two archers, ten competitions, six appearances each, three thousand seasons per row.)
The loss is expressed in competitions because that is the unit in which a calendar is written. I measured what shortening the season costs: going from ten competitions to nine, the probability of identifying the best archer falls by 2.7 points. Saying that three anomalous arrows in a hundred cost as much as removing two competitions is more useful than saying they cost five percentage points; a federation knows what removing two competitions from the calendar means, and does not know what losing five points means.
Four remedies, three failed
The natural reaction is to change the way the estimation is done. The procedure of chapter 46 seeks the values that minimise the overall discrepancy, and a criterion of that kind is notoriously sensitive to extreme values: a criterion that gives less weight to large discrepancies ought to do it.
I implemented one: the Huber loss, with the threshold at the classic value and the scale of the residuals measured in such a way that it is not itself inflated by what one wants to attenuate.
It does not work. The error of the robust estimate is worse than that of the ordinary method in every configuration, including the contaminated ones.
The reason is that the tails do not produce anomalous rounds: they produce slightly worse rounds. Five out-of-pattern arrows out of seventy-two move the total by a few points, not by twenty, and the residual of a contaminated round lies inside the ordinary distribution of residuals. A robust estimator has nothing to recognise: it looks for the freak round and does not find it, because adding up seventy-two arrows has already diluted the accident inside the total. The aggregation has already done the work robustness would have done, and what remains is not a heavy tail in the residuals, it is extra fluctuation. More information is needed, not a cleverer calculation.
This makes Part Three more solid, not less, but let me state precisely what the test shows. It shows that this robust loss, on these configurations, recovers nothing: the comparison is worth about a tenth of a point of error, always against the robust estimator and always at more than three standard errors. It does not show that no estimator can recover, which is a different and stronger statement than a test on a single family of losses can support. The explanation I have given makes the strong version plausible, but plausible is not demonstrated.
The asymmetry that does not come from shooting
One last thing, because it is easy to confuse two different phenomena.
Elite archers’ scores are asymmetric: relative to their own mean, much can be lost and little gained. It is tempting to read this as proof that the impacts are not Gaussian. It is not.
The seventy-two-arrow round has a maximum, and an archer shooting close to that maximum has little room above and a great deal below. With perfectly Gaussian impacts and no tails, the asymmetry of the score grows with level: it is −0.073 at 600 points, −0.083 at 690 and −0.257 at 710. At that level three standard deviations remain above the mean and infinitely many below: a 710 archer cannot score more than 720, but can perfectly well score 690.
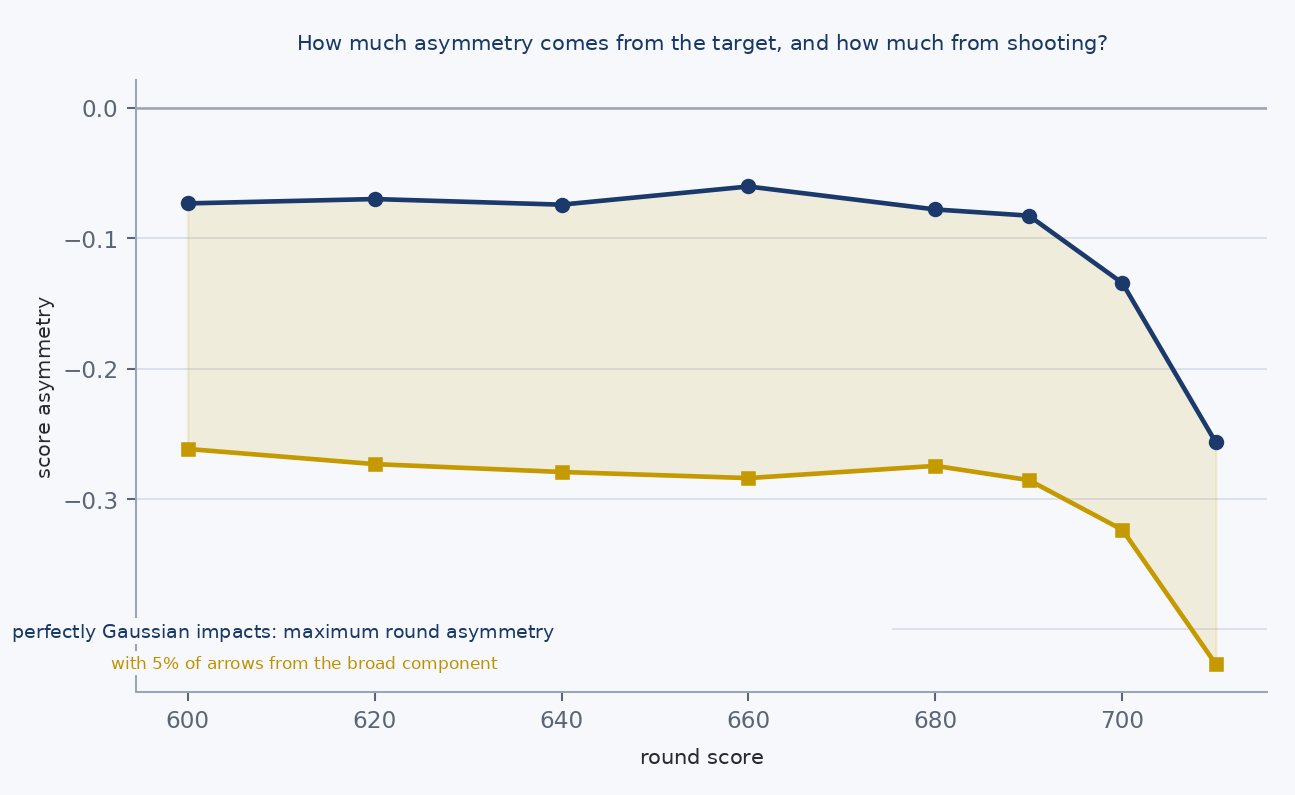
Figure 22. The asymmetry that comes from the target and the one that comes from shooting. Asymmetry of the round score as a function of level, over all 72-arrow rounds of one archer, with Gaussian impacts and with tails. The part that grows with level comes from the maximum of the round; the flat part, from the tails.
The tails add a contribution of about two tenths, but one that is almost constant at every level. The separation is therefore clear-cut: the asymmetry that grows with level comes from the target, the flat part from the shooting. At 690 points the maximum of the round explains less than a third of the observed asymmetry; at 710 it explains sixty per cent. Anyone observing an elite archer and attributing all his asymmetry to the tails would be wrong, and would be more wrong the better the archer is.
A rule the model does not implement
A divergence from the rulebook has to be declared. The rulebook provides that if both archers miss the scoring area in a shoot-off the arrow is shot again; the model, by contrast, always awards the win to the arrow closer to the centre, and does not distinguish that case.
What it costs to know this can be computed exactly. Across the whole domain of the volume the largest value is 3.3 in ten thousand, that is, one double miss every three thousand shoot-offs, and it occurs at the lowest level with the heaviest tails. In the elite domain, where the conclusions are decided, it falls to two in a hundred billion with ten per cent tails, that is, once every fifty billion shoot-offs, and to 6 in 10 to the eighty-second with Gaussian impacts, which is a formal way of saying never.
Implementing the re-shoot would not change one digit of this chapter. Saying nothing about the divergence would have been worse than declaring it.
What to take away
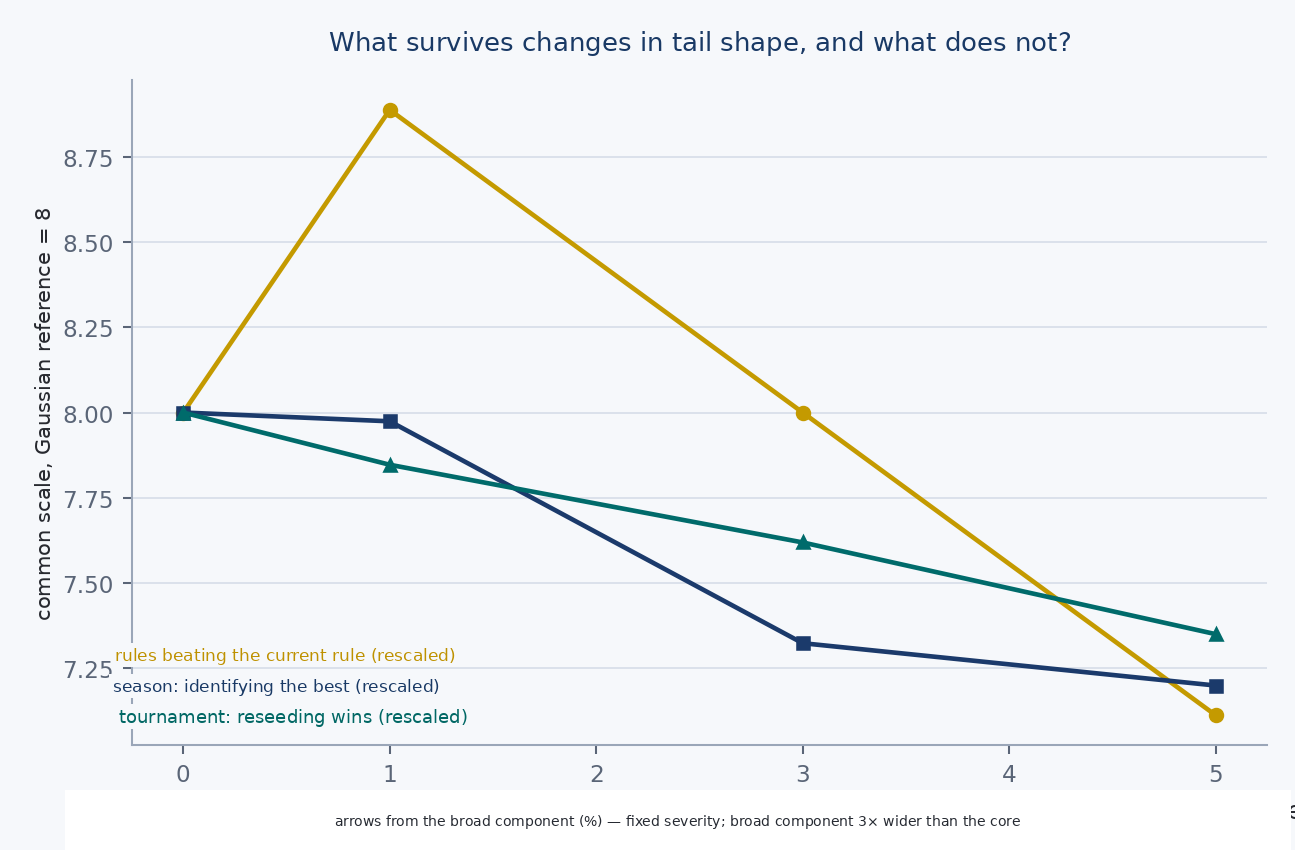
Figure 23 — What holds and what falls. Outcome of each family of conclusions in the volume as the fraction of out-of-pattern arrows grows: the tournaments hold, the tie rules reorder, the season ranking loses.
The picture is not uniform, and that is what makes it useful.
The conclusions about matches and tournaments hold. What those formats measure is above all the dispersion of the score, and once mean and fluctuation are matched the residual effect of shape is a few tenths of a point. It does not hold in general — the counterexample of a few pages ago rules that out — but it holds here.
The order of the fourteen methods does not survive even one anomalous arrow in a hundred: already at that point the leading rule changes and eleven pairs of rules swap places. With three in a hundred the concordance with the Gaussian order is at zero; with ten it is −0.56.
Part One’s recommendation survives, but in a weaker form than the one I had written. It is not true that reading the match always beats the arrow alone: with ten anomalous arrows in a hundred TOTAL+ falls to 54.92 and drops below the shoot-off, which is worth 56.08. But six methods that read the match still beat the arrow: the two cascades, CONCUR, tens then Xs, the arrows below ten, the X count. What changes is which ones, not whether.
The result that gives chapter 14 its title falls first of all, and it falls a long way: the ten count goes from 44.45 to 63.85, that is, nineteen points. It stops being worse than a coin with as few as three anomalous arrows in a hundred, and with ten it identifies the better archer almost two times in three. Anyone wanting to defend the traditional rule has his argument here, and I hand it over: it holds from three per cent of out-of-pattern arrows onwards — the first point on the grid at which the ten count beats the coin — and nobody knows whether out-of-pattern arrows are that numerous.
The conclusions about the season ranking are the most fragile, and here frequency and severity have to be kept distinct. With anomalous arrows three times wider than the core, three per cent costs as much as two competitions on the calendar and five per cent a little more than two. If the anomalous arrows are four times wider, five per cent already costs as much as four competitions. The robust loss I tested recovers none of it; whether some other estimator could, this chapter does not say.
One question remains that this chapter cannot close, and it is the most important: what ε actually is. The instrument for estimating it from scorecards is written and tested on a grid crossing frequency, severity and sample size: if the severity is estimated jointly with the frequency, it recovers the true value to within 1.13 percentage points; but if it is fixed at a wrong value the frequency is overestimated by up to 2.27 points — and of the severity, in real archers, this work has no empirical estimate. From the rings alone the two are confounded with each other: the coordinates of the impacts would be needed.
Until that number exists, the honest way to read this volume is with the threshold alongside each conclusion. And the lowest threshold, the one that should be the first concern, is that of the season ranking: 2.0% if the anomalous arrows are three times as wide as the core, 1.2% if they are four times as wide. It is not three per cent; that is merely the first point on the grid at which the effect becomes visible.
54. The thread running through the three parts
The three parts are not three studies set side by side: they are linked, and the way they link is the result I had not foreseen at the outset.
Part Three produces a season ranking. That ranking, used as the seeding, is the ingredient that in Part Two is worth more than any other single intervention: four more titles per hundred editions, at zero cost. And Part Two contains Part One, because the tie rule is the last step of a competition and not a problem in itself. The ranking therefore stops being a December prize and becomes the thing that decides who meets whom in May.
Each part, moreover, does the same thing: it fixes a ceiling and measures the distance between practice and that ceiling. For the tie the ceiling is one and six tenths of an archer moved per competition, and the rule in force moves three quarters while TOTAL+ moves one and four. For the competition the ceiling is fifteen titles in a hundred, and the current competition delivers ten. For the ranking the ceiling is three quarters with full calendars, and partial calendars bring it down to three fifths.
And every time the space compresses, and the decision passes to an axis that was not under discussion.
| What was being discussed | What separates best from worst | What actually decides |
|---|---|---|
| the tie rules that beat the one in force | 0.4 points between the current one and the best | time, spectacle, robustness |
| the match formats | a third of a match out of 63 | which spectacle is wanted |
| the bracket structures | 1.7 points on a base of ten | where the seeding comes from |
| the ranking methods, with full calendars | three tenths of a point | who shoots alongside whom |
(Summary of the four instances. The units of the rows differ from each other — matches, points of probability — and are not to be compared vertically: the column says how narrow each space is, not which is the narrowest.)
The three ceilings go into a single form, which is the quickest way of seeing what this work has established.
| What is being decided | Where it stands today | Where it can get to | What stays out of reach |
|---|---|---|---|
| A tie — who wins a level match | 57 times in 100 | 63 with TOTAL+, 69 by measuring distances | 31% of cases remain undecidable |
| A competition — who wins the tournament | 9.7 times in 100 | 13.7 at no cost, 14.2 with the precision design | 86 times in 100 the title does not go to the best |
| A season — who is the best of the year | 59 times in 100 with partial calendars | 75 with full calendars | a quarter of seasons remain ambiguous |
(The three rows measure different things and are not to be compared vertically: the first is the probability of identifying the better of two archers in a tie, the second that the title goes to the best of a field of 64, the third that the first archer in a season ranking really is the best of 32.)
Read by rows, the table says how solvable each problem is. Read by columns it says something more uncomfortable: the third column is always a long way from the fourth.
Even doing everything possible, a tournament still fails to reward the best archer in five cases out of six. And this is not because the rulebook is badly written, but because a single-elimination bracket does something other than what is being asked of it. Anyone wanting the title to go to the best archer should look at the third row, not the second.
Four times the same outcome, then: the margin compresses and the thing that decides is not the thing under discussion. Put like that it is not a conclusion about numbers but a description of how the problem is made, and it has a practical consequence for anyone who has to intervene: the place to intervene is almost never the place being discussed. Not the tie rule but the bracket; not the format but which spectacle is wanted; not the method of calculation but who shoots alongside whom.
55. What the model does not see
The three parts of this volume have a single model, and that model ignores three real things. Every shot is born there in isolation from the others, always drawn from the same unchanging group: there is no tension building, no arm tiring, no wind shifting, no weight of what is at stake.
The limitation bites in all three parts, but not in the same way. In the first it bites more than anywhere else, because the shoot-off arrow is not just any arrow — it is the most loaded that exists in this sport, shot in the knowledge that nothing comes after it. In the second it enters through the qualification round, which is a whole afternoon during which the wind can change three times. In the third it enters at every competition of the season, and it is the one place where the model treats it explicitly.
Declaring a limitation, however, achieves little. What is needed is to say in which direction each pushes each conclusion, and where possible, by how much.
Pressure
That the shoot-off arrow is distributed like the fifteen that preceded it is a strong hypothesis, and it is not an open question: those who have compared shoot-off arrows with match arrows at real competitions have found a drop in performance precisely there. That the effect is sharper at the competitions that matter most is documented, but not to the same degree for everyone; in the study reporting it the effect is more marked among women, and other work finds differences by sex and by experience. I therefore take the drop as a fact and its magnitude as uncertain, and that is why in what follows I vary it rather than fixing it.
The direction in which that drop pushes, however, depends on how pressure acts, and the three possible cases give three different answers.
If pressure widened both groups proportionally — say by twenty per cent each — nothing whatever would change. The reason is the formula of chapter 7: the shoot-off depends only on the ratio between the two spreads, and multiplying them by the same factor leaves that ratio identical. It is a case ruled out by construction, not by measurement.
If instead pressure adds to each archer a quantity of error of his own, as it is more natural to suppose, then the two groups resemble each other more closely than the archers do, and every rule becomes less informative. That is the case I measured, and I express it in an intelligible currency: let us say that under pressure an archer behaves like one who is weaker by a certain number of points. A drop of 10 points means that the better of the two, at the moment of shooting, is worth 680 instead of 690.
| Drop due to pressure | The two archers become | Shoot-off arrow | TOTAL+ |
|---|---|---|---|
| none | 690 and 680 | 57.0 | 62.95 |
| 5 points | 685 and 675 | 56.6 | 62.8 |
| 10 points | 680 and 670 | 56.15 | 62.66 |
| 20 points | 670 and 660 | 55.5 | 62.4 |
| 30 points | 660 and 650 | 54.9 | 62.24 |
| 50 points | 640 and 630 | 54.1 | 61.96 |
(Reference pair, population of matches ending five-all. Exact calculation: the drop applies only to the shoot-off arrow and not to the 15 of the match, because that is the arrow under pressure. The row with no drop coincides with the values of chapter 17, as it must.)
The result is more robust than one would expect. A drop of 30 points is enormous — it is the distance separating an international finalist from a good regional archer — and it costs the shoot-off arrow barely two points, taking it from 57.0 to 54.9. For the arrow to fall to 52, that is, almost to the level of a coin, would take a drop of 130 points: it would mean that a 690 archer shoots, at that moment, like a 560 archer, that is, like a beginner. In the archery literature I have consulted, drops of that order are not to be found.
And there is a second fact, and it is the one useful for the decision: in the model, a drop in performance on the shoot-off arrow alone widens TOTAL+’s advantage instead of reducing it. Without pressure the gap between the two rules is 5.9 times in a hundred; with a drop of 30 points it rises to 7.4.
The reason is simple: the match total has already been written and pressure no longer touches it, whereas the shoot-off arrow has yet to be shot. The harder pressure bites, the more it pays to read the scorecard rather than add a shot.
A third case remains, and it is not measurable. If a separate quality really existed — coolness, the shot under pressure — then the shoot-off would be measuring it, and would be measuring well something other than accuracy: not an imprecise instrument, but an instrument pointed elsewhere. The model cannot distinguish this case from the previous one, and anyone asserting the former bears the burden of measuring it.
Wind
Here the direction is the same, but the magnitude is far greater, and this is the factor the volume most underestimates.
Wind adds to both archers an error that does not depend on how good they are: it blows the same way on one archer’s arrows and on the other’s. The consequence is that the two groups widen by a common amount, and therefore come to resemble each other.
| Magnitude of the wind error | Better archer’s group | Weaker archer’s group | Ratio | Shoot-off arrow |
|---|---|---|---|---|
| none | 4.46 cm | 5.14 cm | 1.152 | 57.0 |
| 2 cm | 4.89 | 5.51 | 1.128 | 55.88 |
| 4 cm | 5.99 | 6.51 | 1.087 | 54.1 |
| 6 cm | 7.48 | 7.90 | 1.056 | 52.7 |
| 10 cm | 10.95 | 11.24 | 1.027 | 51.3 |
(Reference pair. The wind error is modelled as a common random component added to that of each archer.)
The column of groups says everything on its own. With six centimetres of wind error the 690 finalist’s group becomes wider than the one the 680 quarter-finalist had on a calm day: 7.48 against 5.14. The two groups remain different, but their ratio falls from 1.152 to 1.056; that is, the two archers become almost indistinguishable on the target.
And indeed the shoot-off falls from 57.0 to 52.7, that is, it loses more than half its margin over the coin. Six centimetres is a windy day but not an exceptional one.
The effect strikes every rule together, not only the arrow.
| Magnitude of the wind error | Probability of five-all | Shoot-off arrow | TOTAL+ | Gap |
|---|---|---|---|---|
| none | 16.8% | 57.01 | 62.95 | 5.94 |
| 3 cm | 17.5% | 55.05 | 59.85 | 4.80 |
| 6 cm | 14.3% | 52.74 | 55.73 | 2.98 |
| 10 cm | 14.9% | 51.32 | 52.90 | 1.57 |
(Reference pair, population of matches ending five-all. Exact calculation: the wind adds a common error to both, so all sixteen arrows widen and not just the sixteenth.)
On a day of strong wind every rule converges towards the coin, and the choice among them stops mattering. TOTAL+ retains an advantage across the whole scale, but that advantage thins from six times in a hundred to one and a half.
A practical consequence follows that nobody ever formulates and that is worth writing down: it is the windy day, not the tie rule, that decides how far a competition is a lottery. In the wind-noise scenario modelled here, the effect is far larger than that of any tie rule. The model, however, adds a common random component and does not simulate meteorology, venues or scheduling: whether a choice of venue really reduces that noise, and by how much, this work does not measure.
What is at stake
It is the factor on which I have least to say.
There is no way of putting it into the model that is not arbitrary. That the stakes act through pressure is a plausible reading and not a relationship I measure: what I have measured is how the numbers change if the shoot-off arrow is shot worse than the others, not why it should be.
What can be observed is that the two things are not independent: a gold-medal final has both the highest stakes and, typically, the two archers who are closest to each other. And it is the worst combination, because the first factor erodes accuracy and the second reduces the gap to be measured.
With the tightest pair a final can present — two archers 5 points apart — the shoot-off arrow falls to 53.6 in a hundred, and with a pressure drop of 20 points it reaches 52.9. Which says something worth keeping: the shoot-off is least reliable at precisely the moment when it is used to decide most.
56. What changes in each conclusion
Declaring that the three factors push downwards is not enough, because the volume does not contain a single number: it contains different conclusions, and for each one has to ask in which direction it is moved. I did the reckoning taking the wind as the reference factor, because it is the most severe of the three.
| Conclusion of the volume | Without wind | With 6 cm of wind | Effect |
|---|---|---|---|
| The title goes to the best archer | 9.7% | falls | worsens |
| The seeding is off by 8.6 places | 8.6 | rises | worsens |
| The rule in force identifies the better archer | 57.01 | 52.74 | worsens |
| The margin available for a better rule | 5.94 points | 2.98 | worsens |
| The ten count is anti-informative | 44.66 | 47.27 | attenuates |
| How often the total ties | 34.4% | 19.5% | attenuates |
(Reference pair, 2 million matches per row. “Worsens” means that the excluded factor makes the conclusion more marked than reported here, “attenuates” the opposite.)
Four conclusions out of six are worsened, and they are the load-bearing ones. The rule in force, which on a calm day identifies the better archer 57 times in a hundred, in the scenario with six centimetres of wind error identifies him 53 times. The number the volume reports is therefore that of the windless case, and every wind scenario tested lowers it; what the real field does, these simulations do not observe. The same applies to the title going to the best archer and to the error in the seeding.
The two exceptions have to be stated with the same clarity, because they are the only ones in which an excluded factor works against a conclusion of mine.
The first is the reversal of the ten count: wind attenuates it, from 44.66 to 47.27. The mechanism is that of chapter 20 — wind adds dispersion to every arrow, which loosens the link between tens and low arrows. It does not cancel it, because the criterion stays below the coin even with ten centimetres of wind, where it is worth 48.84. But anyone wanting to defend the ten count has his one argument here, and I hand it over.
The second is more technical: with wind the total ties less often, from 34 to 20 per cent, because the two sums move apart. This reduces the number of cases in which TOTAL+ has to resort to the arrow, and therefore, paradoxically, on a windy day TOTAL+ behaves more often as a pure rule and less as a two-stage one.
The direction, however, remains the same under all three factors of this chapter: TOTAL+ stands ahead of the shoot-off arrow with wind and without, under pressure and without, and under pressure it stands further ahead. What the wind erodes is the absolute margin — from 5.94 points to 2.98 with six centimetres of wind, and to 1.57 with ten — not the order.
Be precise about what this means and what it does not. Pressure, wind and what is at stake do not reverse the comparison between the two rules. The marked tail of chapter 21 does, and it remains the only configuration tested in all this work in which TOTAL+ ends up below the rule in force. The three factors of this chapter therefore add no new risk to the proposal: they aggravate the problem common to every rule, which is how little margin there is altogether.
57. The limits
Before the recommendations, the boundaries of this work. There are five, and the fifth is the one promised in the first chapter.
The first is that ability, here, is a single quantity: the expected score, and nothing else. An athlete, however, is also other things — the capacity to hold up over a whole day, the way he reads the wind, the readiness to get back on his feet after a bad round. None of these enters the calculations. If one believes that a tournament should reward those qualities, this work measures the wrong thing, and the correct response is not to correct its numbers but to reject its definition.
The second is that what I change is the arithmetic and not the behaviour. In comparing two rules I hold the arrows already shot fixed and replace only the criterion by which they are read; but under a different rulebook it is likely that the athletes would behave differently, and perhaps from the very first set. It is the limitation of every counterfactual argument about a sporting rulebook, and the only thing that would dissolve it is a competition actually shot under the new rule, which by definition does not yet exist.
The third concerns how much can be concluded from a single encounter, and the answer is: almost nothing. Who was the stronger archer that afternoon is not an observable quantity. By accumulating enough competitions one can estimate which of two archers groups more tightly and with what margin of error; on a single day, by contrast, certainty is not reached, and no conclusion in these pages is to be read as a judgement on a competition that actually took place.
The fourth is that the shape of the tail is not estimated. I have measured what knowing it would be worth and the structural reason why it probably will not be known, but that is not equivalent to knowing it: it is the number that decides whether TOTAL+ is the right choice or whether CONCUR is needed, and it is open.
The fifth, and it is the one announced at the start, is that the effect of shooting order in the shoot-off is not measurable with the data that exist today. The rulebook establishes that in the shoot-off the archer who shot first in the first set goes first, and the order of that set is chosen by the higher qualifier, who may choose to shoot second, and sometimes does. If an advantage of order existed it would be confounded with an advantage of ability, because in the available data the two things almost always appear together.
And it has a practical consequence that costs nothing: drawing lots for the shooting order in the shoot-off would be enough to make the question answerable with the data a federation already collects. It is the fourth paragraph of the article in chapter 18, the only change in these pages that serves not to improve a rule but to make measurable something that today is not.
The direction of the limits
There is a general consequence worth repeating, because it is the right way to read the whole volume.
Four of the five limits just listed — all but the third, which concerns what can be observed and not how much can be distinguished — have the same direction. Ability reduced to a single quantity, behaviour held fixed, the tail not estimated and the shooting order not measurable each push towards a lesser capacity to discriminate, not a greater one. The same holds for the three factors of chapter 55, with the single exception declared there.
The numbers in these pages are therefore a benchmark under the stated assumptions, and for the departures I have modelled the measurements shrink; by how much depends on the day’s wind more than on anything else. That the real field lies below is an extrapolation, not a measurement.
Which has a consequence for how to contest this work, and I write it down because it seems to me the most useful thing to leave to anyone who wants to. Anyone objecting that the model is too simple would be right, and would be objecting in favour of my conclusions. The margin I measure here is the maximum available under the stated assumptions, and the complications I have tested reduce it.
I have not proved that every complication reduces it: qualities correlated with ability — reading the wind, holding up under pressure — could also increase the separation between archers. Anyone wanting to refute this volume would therefore have to show not that I have neglected something (I have, and I have listed it) but that something neglected pushes in the opposite direction. It is a thing that can be done, and it is a different job from listing the simplifications.
There is, finally, a limitation concerning the verification apparatus and not the content. All the checks described in the note on method verify the calculations, and none verifies the meaning attributed to a number: in a final review of files never re-read, four defects of that kind emerged, all of them exact numbers with the wrong label. Anyone reading the apparatus without this limitation infers from it a guarantee that is not there.
58. How a result expired without becoming false
Here in full is the most instructive case in this work, because it is a way of being wrong that no check intercepts and that in a long project is probably the commonest.
Part One was closed and archived before Part Two existed, and among its results was the comparison between the weight of the bracket structure and that of the tie rule: the measured ratio was about five to one.
That comparison, however, measured the range across structures on the assumption that the seeding was the true order, and nobody had written it down as a hypothesis, because it had not occurred to anybody that it might be false. The bracket is built on the seedings, and the seedings are what they are.
Then Part Two measured how reliable they are, and the answer was that in a compact field the qualification round practically never gets the best eight right. And the structures that gained most were precisely those that consult the seeding several times: with the real order the range across structures falls from six and a half points to less than two.
That the structure matters more than the rule remains true, and on two independent derivations, the second of which does not go through the seeding. What changes is the factor: the bracket is the thing that matters most, and it too matters little.
And there is a new quantity that the old number contained without knowing it. The difference between the two is the price of ignorance about the seeding: relative to the standard bracket, reseeding would be worth five points if we really knew who was the better archer, and it is worth one point one with the qualification round we have. Those four points, in round numbers, are what is bought by improving the seeding. Put another way: four titles per hundred editions are already on the table today, and nobody takes them because the bracket looks for them where they are not. It is the reason Part Two ends where it ends.
The shape of the error is worth more than the error. The number was not wrong: it was correct for the cases on which it had been computed, and those cases assumed something nobody had ever measured. It is a result that expires because the set over which it was defined changes underneath it, and these are the cases no check intercepts, because at the point where they happen nothing happens. No test fails, no number turns strange, and the result goes on being repeated until somebody measures the hypothesis nobody had written down.
59. What I predicted, and what proved me wrong
Before calculating I had declared a series of expectations in writing, and I report how they turned out, because it is the only guarantee that the results are not reconstructions of what I hoped to find.
These were wrong. That pairs with appreciable differences do not reach five-all. That the cascade was the answer. That the set system cost a great deal. That the variable-length format was the best candidate. That the anti-informativeness of the ten count would withdraw under any departure from the model. That the value of knowing the tail would stay below the threshold. That the repechage, being more robust, would overtake reseeding with a worse qualification round. That on a fixed bracket improving the seeding beyond a certain point was not worthwhile. That the connectedness of a calendar mattered.
These were right. That the structure mattered more than the rule. That the standard bracket suffered less than reseeding from a wrong seeding. That pairing among the leaders would recover the whole gap between calendars — and here the finer measurement corrected the prediction on one point, because extending the pairing beyond the top eight produces no benefit these data can resolve.
Only half right, on the other hand, was the one about the X ring: being a subdivision inside the ten it does indeed escape the arithmetic constraint on close pairs, but as the gap grows it falls back under it, and below forty points of distance it too drops below half.
There is a regularity in this reckoning: the structural intuitions worked almost always, those about magnitudes almost never. I knew where to look; I did not know how large what I would find would be. And there is a more precise formulation, arrived at after three consecutive errors of the same kind: understanding a mechanism licenses predicting which way it pushes, not who wins the comparison, because it describes a force and not its balance against all the others.
A note for anyone wishing to contest the argument: a high rate of refuted predictions is evidence of genuine measurement only if the predictions were declared beforehand and were specific enough to be capable of being wrong. It is having written them down in advance that makes the argument valid, not the count of errors, and at the points where the stakes were high they were put in writing in a document dated before the calculation was run.
60. What I would say to those who have to decide
First of all in a table, because whoever has to decide needs to see together what each intervention costs and what it yields.
| Intervention | What changes | What it costs | What it is worth |
|---|---|---|---|
| Bracket from the ranking, with reseeding | two lines of the rulebook | nothing | +4.0 ± 0.3 |
| Repechage from the quarter-finals | 4 extra matches | an hour of competition | +1.1 ± 0.2 |
| Tie rule on distances | instrumentation | nothing visible | +0.7 ± 0.1 |
| Ordering the qualification by distances | instrumentation | nothing visible | +0.5 ± 0.3 |
| TOTAL+ on the tie | one line of the rulebook | from 10.6 to 3.6 shoot-offs | +0.33 ± 0.09 |
| Dial at two points | one line, with a threshold | from 10.6 to 8.0 shoot-offs | +4.4 on the tie |
| Match format | any change | variable | ±0.3 of a match per competition |
| Individual award above a declared margin | one line of the rulebook | three awards in four become collective | not measurable in points |
| Pairing the competitions of the top eight | six competitions in common among the eight | nothing | +0.8 ± 0.6 on the ranking |
(The first five rows all come from the same values file, p2_modelli.json: same paired run, twenty-five thousand tournaments, declared seed, compact 64-archer field, and they are gains on the probability that the title goes to the best archer relative to today’s competition, which is 9.712. The error reported is that of the paired contrast. The dial and the match format are measured on the population of tied matches and not on the title, so they are not comparable with the first five; the last row is on the probability that the first archer in a season ranking is the best of 32 and does not add to the others. The first two changes can coexist, but their joint effect has not been estimated: the two gains are not to be added. Those on distances are alternatives to the first two if the unchanged-format route is chosen.)
Two things are to be read in that table before the others. The first intervention is worth more than twelve times the second and costs nothing more, and it is the one never discussed. And the last acts on a different question — not who wins a competition, but who turns out to be the best of the year — so it is not to be added to the others.
Then, in order of what they are worth, the nine recommendations in full.
The first intervention does not concern the tie rule and costs nothing: composing the bracket from the season ranking instead of from the score of the day, and recomposing the pairings at every round. The title goes from reaching the best archer one competition in ten to reaching him almost one in seven, without removing a match, a shoot-off, a minute or an arrow. It is the balanced design of chapter 38, and it is two lines of the rulebook.
The second is the tie rule, and it is one more line: the archer with the higher total wins, and if the totals are level too an arrow is shot. It takes 85 per cent of the available margin against today’s 50, it is verifiable by eye, and it has 3.6 shoot-offs shot per competition instead of 10.6.
For anyone unwilling to change even those two lines there is a third route, which touches nothing that is seen: same qualification, same bracket, same duration, changing only how the results are read. It is worth 1.1 points, that is, one title in a hundred, and it comes to two interventions: ordering the qualification by distance from the centre is worth 0.5, settling ties on the same measurement is worth 0.7, and together they give less than the sum because in part they buy the same thing. Both require recording where each arrow landed within the ring, which nobody would see from the stands. Anyone who cannot afford that instrumentation has one alternative, and it concerns the tie: reading the match total before the arrow, which is worth 0.3 points and costs nothing. It is an alternative and not an addition — the two tie rules cannot both apply to the same match.
The traditional criterion should be removed and not reordered. Counting tens after a tie on score (and in the rulebook in force it is the criterion for ordinary qualification ties, not for cut-offs or for matches) points to the wrong archer under the model adopted here, because at a fixed total that measurement says who concentrated his deficit and not who shot better. It is the only recommendation in the volume that Appendix B shows to depend on the shape of the tails. It applies to the qualification ranking too, where the X count and the ten count do no harm but add nothing: three tenths the first, zero the second.
If the shoot-off is to be defended, it can be defended at a known price: the dial at two points keeps eight shoot-offs out of ten and still gains four times in a hundred over the rule in force. It is not true that accuracy and spectacle are mutually exclusive.
On the format there is nothing better to propose, and the useful thing is to know it: the three constant-arrow formats lie within a third of a match out of 63, and the choice is about which spectacle is wanted (changes of lead or finishes in the balance) and not about which is fairer.
On the annual ranking, two rules that can be written immediately. An individual award only above a margin declared in advance, which with ten competitions is two points if the certainty required is ninety per cent and three if it is ninety-five; in the first case the award can be given a little over one season in four, in the second one in ten, and in the others the honest form is collective. What certainty is required is a decision for the federation, not a result of this work: here are the numbers for taking it. And an admission threshold of 60 per cent of competitions and no higher, because total immunity is bought by excluding those who cannot be there.
There is then a road that would lead out of the narrow margin in which everything else struggles, and it is measuring distances instead of rings: it takes the ceiling of the tie rule from one and eight tenths of an archer to two and a half per competition, and it requires a precision of 3 millimetres that is not laboratory precision.
And finally the thing that is not a recommendation but reorders the discussion. With full calendars a season identifies the best archer three times out of four; a tournament, as organised today, does so once in ten, and once in seven even adopting all the best that these pages propose.
The problem is not that the tournament gets it wrong: it is that it is being asked to do two things at once. Anyone wanting to know who the best archer is already has an instrument, and it costs ten times as much. Anyone wanting a spectacle has another, and for that it works very well. Asking both of the same event is the reason neither fully succeeds.
Regulatory sources. The rulebook cited is World Archery’s, Book 3, in the version dated 13 March 2026. And the times for a single arrow: twenty seconds in alternating shooting, thirty in simultaneous shooting at World Ranking and announced events, forty at all others and reducible to thirty by the organiser.
Nature of the results. This is a modelling study, not an empirical one. It describes the behaviour of rules, formats and procedures in the abstract, and does not claim to say what happened at any particular competition. No real competition data have been used. The calibration starts from scores chosen as representative of a top-level field, 690 downwards out of 720, and these are a declared assumption of the model, not a measurement of a population: the rest is derived from there.
How the numbers were obtained. Where a closed form exists, it is used. Where the possible cases are finite in number, they are all enumerated rather than sampled. Where simulation is needed, the same matches are used for all the rules being compared, so that the differences carry much less noise than the levels. Computed exactly: the probability of five-all, the structure of the bracket, the form of the shoot-off, the ceilings by information set, the cost of the set system and the spectacle measures. Simulated: the overlap of calendars and manipulability, with the number of repetitions chosen so that the error falls below the digit reported.
How they were checked
Three things, in order of what they are worth.
The first is the agreement between the exact method and the simulated method, where both are available. It rules out model error and implementation error together, whereas two simulations that agree measure only their common noise. The reversal of chapter 15, for example, was recomputed exactly as well as by simulation, and the two routes give the same sign across the whole grid.
The second is the verification package accompanying this volume, described below.
The third is that every check has been tested against the fault it is supposed to intercept. A check that has never failed is not a check: it is a decoration, and testing it consists in deliberately breaking one value at a time and verifying that somebody notices.
The verification apparatus
Delivered with this volume is the apparatus for re-running its numbers.
motore.py (the engine) contains the match and tournament calculation functions, each named after the appendix formula it corresponds to, and it keeps the competition fields as an external parameter rather than as an assumption written into the code. The joint estimation of the season ranking is in stagione.py, and it is the only route for Part Three; it refuses to answer if the archers are not all connected to each other, because between separate groups the difference in origin is not in the data.
catalogo.py declares every quantity before computing it — what it is, over which population, in which units, relative to which reference level — and produces it from the engine.
The second independent implementation does not import the main engine: it derives the spread of the group by successive trials rather than from the closed form, and plays every match arrow by arrow rather than consulting a precomputed table. Its verifier compares seven quantities — two match results, two conditioned ones and three tournament structures — and in the release all of them fall within the declared tolerance. It is a strong validation and one limited to those seven: it does not hold for what that script does not run.
The previous generation of the apparatus is not part of this package and is distributed separately, because on the repechage structures it shares the defect the engine has since corrected — a single random number per pair of archers, which forced the winner of the first encounter to win the rematch as well. Two implementations sharing a defect do not validate each other: they agree because they are wrong together.
estrattore.py reads the text of the volume and requires every printed number to have an entry in the catalogue: 2,134 quantities, all covered. If it finds one without an entry, it fails.
Let me state precisely what this demonstrates and what it does not. Coverage recognises a number by numerical compatibility with a catalogue entry, and in a volume of two thousand quantities a wrong digit almost always finds a namesake. It therefore rules out a number being invented, not its being the right one for that cell.
The defence against the wrong cell is the explicit link, and alongside it stands a register. registro.py writes REGISTRO.md: for every quantity the volume uses to recommend something — what it measures, over which population, relative to which reference, from which producer and from which run (repetitions and seed), the value, its error, and how many sentences or cells are anchored to it. The decision quantities number twenty-eight and all of them have at least one link. The register lists in any case those that have none, because it is on those that a divergence would remain legible instead of turning red. vincoli.py anchors 88 decision cells and 56 sentences to a precise catalogue entry — identifying the cell before looking at its value — and fails if the printed figure is not the one the producer computes. Outside those cells the guarantee is weaker: most quantities are linked to an entry in their own chapter, the rest are restatements of quantities produced elsewhere.
manifest.py writes the provenance chain of the figures — which function produces each one, which files it reads from, and whether the drawing embedded here is the one the current code produces — and fails if a figure has more than one generator, which is how an old version survives alongside a new one.
collaudo.py breaks the values one at a time and verifies that they are intercepted. Each test breaks the volume in a different way — a cell printing a different value, a producer that changes while the page stays behind, a figure that does not match its own generator, a file that changes after freezing, a count wrongly declared, the sign of a gain inverted — and each requires not only that the command fail, but that it fail for the right reason. In writing them I discovered that some faults were passing undisturbed, among them inflating the gain of the balanced design in the table of recommendations.
Anyone wishing to refute a figure need not take my word for it: they open the catalogue, change the disputed value, re-run, and see whether the check intercepts it. If it does not, the tolerance is too wide and that is a defect to be reported.
A check of a different kind: rewriting from the prose alone
Besides recomputing the numbers I did something no automatic check can do: I rewrote the procedures reading only their description in these pages, without looking at the code, and compared the results.
The seven tie rules all come back within a quarter of a point. The standard bracket and reseeding, the cascade, CONCUR and three of the five formats come back within simulation error. The first two steps of the Part Three procedure come back to the digit.
One quantity alone diverged — the format of 15 sets of one arrow — and the reconstruction was right. I recount it in full, because it is the deepest defect this volume has contained.
The structure of the match agreed to the sixth digit: both implementations gave the same probability of reaching fifteen-all. The difference lay entirely in the way it was settled. The cause was this: what TOTAL+ was worth was computed once only, on the matches that end five-all in the format in force, and then reused for all five formats. But the matches one format sends to a tie are not the same ones another sends there, and on different matches the same rule is worth a different amount. The correction was to compute each format on the matches that format actually sends to a shoot-off.
Recomputed on the right matches, the short-sets row falls by two tenths at all three gaps, the long-sets row rises by two hundredths, the two variable formats do not move, and the format in force comes back identical to the fourth digit, because it was the one on which the value had been computed.
The same value also enters the tournament simulation from which the precision design emerges, which is the only one of the four to use the short-sets format. That design was therefore recomputed with the correct method, and the value that comes out, 14.22 per cent, is the one the volume reports throughout: the correction is already inside, it is not a subsequent revision.
Why the correction is so small matters, because it is a mistake I made myself before computing it. Estimating it from the table of formats, where the row falls by two tenths, I had predicted a drop to around 14.8. But that table is at six, eleven and twenty-five points of gap, whereas in a compact field two neighbours in the ranking are four tenths of a point apart, and at that gap the two values almost coincide. The true correction is three hundredths, not two tenths: ten times less than the estimate suggested. It is the reason the number has to be computed and not extrapolated, and this time I learned the lesson from my own mistake.
The consequence for the reader is that the advantage of the best format over the current one halves, from half a point to three tenths, which strengthens the chapter’s conclusion rather than weakening it: the space of formats is even flatter than I had written.
What the package has already corrected
This is how the apparatus earned the trust I ask for it.
Reconstructing the quarter-final repechage independently I obtained 7.8 per cent against the 10.9 published. It was not a calculation error on either side: it was that the sentence with which the volume described that structure admitted four different competitions, with results between 7.3 and 11.2 per cent. The description has been rewritten so that only one reading remains possible.
The same comparison brought out the number of matches in that structure, which is 67 and not 66; the accuracy of the late-round repechage in the table of six structures, which is 11.7 and not 10.60; and the magnitude of the Part Three competition effect, which is eleven points and not eight.
One table was not reproducible and has been redone. The comparison between true seeding and real seeding in chapter 27 came from a run not preserved as code, and it has been recomputed by the engine over one hundred and fifty thousand tournaments. The levels moved by about a point, while the chapter’s conclusion did not move: reseeding pays a toll four times that of the other structures.
How much of the volume is covered, and in what way
This is the question anybody ought to put to me, and the honest answer is: not all of it.
In the text of this second edition 2,134 substantive quantities appear, and the catalogue declares all of them: 983 are linked to an entry in the chapter in which they appear and 1,151 coincide with a quantity produced elsewhere that the text refers back to. The coverage check was re-run on the rewritten manuscript, not inherited from the first edition, and it leaves no number uncovered.
I have to state precisely what this demonstrates and what it does not, because it is the limitation this edition has made visible. Coverage demonstrates that every printed number comes from the engine; it does not demonstrate that the sentence around that number attributes the right meaning to it. A hostile review of this edition found several cases in which the new prose said more than the data — a design with three values under the same label, a conclusion founded on a measurement the text itself declared in need of redoing, an intervention given as null that the producer measures as positive. All corrected, and none of those defects would have been intercepted by a numerical check.
Every table in the volume is verifiable, and some are also regenerable from scratch.
What the checks do not see
Two things, and I list them because anyone reading the apparatus would infer from it a wider guarantee than the one there is.
The first is the meaning attributed to a number. No check verifies that the label above a column is the right one. In a final review of files never re-read, four defects emerged, and none of the four was a wrong number: they were exact numbers with the wrong label. A subsequent review, conducted with a catalogue that declares population, units and reference before the calculation, found others of the same family — a value computed counting shared first places as firsts, two cells that were the exact values of two other pairs, and a table declared exact that was not.
It is the most insidious class of defect, and the catalogue reduces it without closing it. The procedure that closes it is not technical: it is re-reading every caption after an interval, saying in one’s own words what the column measures, and comparing that statement with what is written. Whoever produced the number re-reads it already knowing what it is supposed to say, and that is why the re-reading has to be done with the catalogue entry alongside and not from memory.
Precision declared by part
Part One is in exact form almost throughout, and its figures hold to the second decimal place.
Part Two is simulated, and the runs are not all of the same length: twelve thousand tournaments for the comparisons among origins of the seeding, twenty-five thousand for the common run of the four designs, forty thousand for the comparison among tie rules, one hundred and fifty thousand for the paired tolls. The number of repetitions and the seed of each are in the table caption and in the register of decision quantities. The error on the winning probabilities runs from one to four tenths of a point depending on the run, so two significant digits are to be read and differences below half a point are absent, except where I report a comparison with everything else held equal together with its error.
Part Three mixes the two: the ceilings are in closed form, the overlap of calendars and the manipulability are simulated.
Comparisons with everything else held equal. Where I compare two alternatives I use the same simulated tournaments for both — same field, same seeding, same match outcomes — so that the difference carries much less noise than the levels. It is why I can declare a gap of half a point between two structures significant while the absolute levels fluctuate by as much.
Reproducibility. The seed of the random generator is fixed in the code, so even the simulated values reproduce exactly. Changing the seed gives different numbers within the declared tolerance, and that is the right way to check them: two runs with the same seed measure only that the code is deterministic. I do not supply the simulation code with this work. If you want to use it, get in touch.
Declared limits
Seven limits, and they hold for the whole volume.
First. Ability is a single quantity, the expected score. An archer is also his stamina over a long day, his handling of the wind, his capacity to recover from a bad round: none of this appears in the calculations.
Second. In the comparison among rules, what changes is the way the data are read, not the behaviour of those who produce them. A different rulebook would probably induce different shooting choices, whereas the calculation holds the arrows fixed.
Third. From a single encounter one cannot recover which of the two contenders was the stronger: that quantity is not observable at that scale.
Fourth. The shape of the tail is not estimated. I have measured what knowing it would be worth, and the structural reason why it probably will not be known (the information lies in events that are rare by definition), but that is not equivalent to knowing it.
Fifth. An archer’s level stays fixed throughout the season. It is the hypothesis that makes it legitimate to average ten competitions into a single estimate, and I measured how well it holds by letting the level walk with a random step from one competition to the next.
For the question I adopt — who shot best this year — the flat estimate remains the best at every drift speed tested: it goes from 73.2 per cent correct first places to 83.2 with a step of three points, because the drift widens the distances between archers and makes the leader more recognisable. For the other question — who is strongest at the last competition — the flat estimate gives way: it falls from 73.2 to 56.1, and an estimate weighting recent competitions more heavily overtakes it beyond one point of drift per competition, that is, beyond three points accumulated over a ten-competition season.
Below that threshold the season can be read as though the level were fixed. Above it, anyone wanting to use the ranking as a seeding (which is a question about tomorrow and not about the past year) would have to weight recent competitions, halving the weight every two or three competitions. It is the reason I distinguish the two uses of the same ranking instead of treating them as one.
Sixth. The effect of shooting order in the shoot-off is not measurable. Any advantage of order is inseparable from an advantage of ability, because the order is chosen by the higher qualifier. Drawing lots for the order would make it measurable, and nobody does it.
Seventh. The double miss in the shoot-off is not in the model. The rulebook provides that, if both archers miss the scoring area, both shoot another arrow; the engine always decides on the arrow closer to the centre. At the levels of these pages, two arrows off the target in the same shoot-off occur twice every fifty billion even with ten per cent tails, and no number in the volume depends on how they would be treated.
A long piece of work produces, besides results, a list of errors. I publish them because they are the most transferable part, and because almost nobody publishes them — not out of reticence, but because almost nobody keeps a record while working.
They are divided into two categories, and the distinction is useful: a principle tells you when you have gone wrong, a note tells you what to do.
Principles
One — Choosing which cases you look at lowers the maximum attainable, not just the estimate. Five-all takes between nine and sixteen per cent of their advantage away from the rules that read the match, before any choice is made about how to read them. And a rule on who may enter a ranking narrows the ceiling of that ranking in the same way.
Two — Every check has to be tested against the fault it is supposed to intercept. A check never seen to fail is not a check, it is a decoration. It is the principle with the most occurrences of all, and it has four distinct forms: silence, when it never fires; noise, when it fires at random; the wrong target, when it fires for the wrong reason; disconnection, when it fires and nobody listens. A check that verified the shape of a curve with a tolerance wider than the true effect certified a false property for weeks.
Three — Two forces in opposite directions produce a maximum in the middle. When two effects act in contrary directions on the same axis, the response rises and then falls, and the sign can invert twice. The gain from a tie rule, the loss from reading by rings, the inversion of the ten count as a function of the tail: three times the same shape.
Four — An upper bound is not an estimate. It licenses saying that the problem is bounded, not what it is worth. A bound used as though it were a measurement turned out to be wrong by eight orders of magnitude, that is, a hundred million times.
Five — The quantity that decides is estimated with far less data than the parameters that explain it. Two hundred and sixteen arrows to take the decision, ten thousand to explain it.
Six — Where the cases are finite in number, enumerate them all instead of sampling some. It holds for calculation and for verification: a proof with a finite number of cases has to be made executable, not illustrated with a sample. With the caveat that estimating what the enumeration costs requires the same attention to units as everything else; counting arrows where pairs were needed made tractable what was not.
Seven — Verification requires independence of method, not of seed. Two simulations that agree measure their common noise. An exact method and a simulated one that agree rule out model error and implementation error together.
Eight — Two alternatives can be compared only if they are comparable: same final stage, same information set. Comparing a truncated rule with a complete one favours the second even when every individual number is correct.
Nine — A criterion defined on a family is not evaluated on one member, and vice versa. “Within three standard errors” repeated over thirty-one cells is not a check at 99.7 per cent: it is thirty-one checks, and over thirty-one attempts something passes by chance.
Ten — A quantity has to be reported in the unit in which the decision is taken. In the wrong currency it is true and illegible. “A factor of eight on the minutes” is true and misleading when in competition units it means nine minutes less; “two point eight seven percentage points” is true and useless when it means one and eight tenths of an archer out of sixty-three matches.
Eleven — The cases a number is computed on have to be the cases the decision acts on. The costliest case in this work is of that shape: the reliability of the qualification round was computed counting a shared first place as a first place, whereas a decision breaks a tie. Over a hundred competitions that makes 16.5 against 14.2, and the second is the one that counts.
On the wrong cases the number is true and not pertinent, and unlike the wrong unit it does not convert: it has to be recomputed. It is the most insidious defect, because a wrong currency can be seen by looking at the number and a wrong population cannot.
Twelve — The absence of symptoms has to be explained, not accepted. Before concluding that something works, it has to be established that somebody was watching. The two worst defects in the work concealed each other, each preventing the other from being seen: a fingerprint never written and a cleanup that deleted the files before anybody read them.
Thirteen — Before writing “until it is known”, estimate what it costs to know. A caution in a footnote licenses writing in the text the assertion the caution declared unestablished. In the case that produced this principle, the measurement that closed the question cost one minute and was already written. The principle holds in three directions: estimate what it costs to know before saying that it is not known; estimate what knowing is worth before spending to know it; estimate what it costs to apply what is already known before merely making a note of it.
Fourteen — A correction applied to one case does not extend to the others of the same class, and knowing that the class exists is not enough to protect them. The remedy is to look for the class when the case is discovered, not to make a note of the case.
Fifteen — Understanding a mechanism licenses predicting which way it pushes, not who wins the comparison. It describes a force, not its balance against all the others. Three consecutive predictions in this work were founded on correct mechanisms and led to wrong conclusions.
Sixteen — A surrogate built to resemble the real object on one statistic is not the real object. An ordering built to have a certain resemblance to the true order and one produced by a simulated season had the same resemblance and different error structures — enough to produce a maximum in the middle that does not exist. Building it to resemble gives the impression of having checked.
Seventeen — A suspicion that explains the data well is not thereby true, and the difference is made by a check that can refute it rather than one that can confirm it. A suspicion that is plausible, consistent with an already established result, and wrong is the most dangerous configuration: consistency with what is already known is precisely what makes one stop checking.
Notes on technique
Eighteen — An automatic transformation applied to the text breaks numbers no check on the calculations can see. Converting numbers from words to digits, I broke a dozen values: 0.9898 became “0.9 eight nine eight”, 692 became “690two”, a range of 19–47 per cent became “nineteen–47”. All the numerical checks went on passing, because the calculations were right and the text was broken — they are two different objects, and the apparatus checked only one of them.
Nineteen — The inventory has to be taken on the numbers published, not on the checks written. In building the verification apparatus I discovered that seven groups of values in the volume were covered by no check at all: the four ceilings, the fourteen methods, the moments of the reversal, the worked example of Part Three. They were not failing; they were simply not being looked at, and that is how a typo survived three revisions.
The right question is not “do all the checks pass”, which is the easy question, but “which check would notice if this number were wrong”, asked one number at a time.
And what can be derived is not maintained by hand. Five load-bearing applications: the scope of the checks defined by the folder and not by the list of producers; analysis of the code structure instead of textual search; the fingerprint derived from the modules instead of from a list; the prose generated from the numbers instead of written alongside them; and the status of a document written in the document instead of in the message accompanying it. A check that looks at one place also finds what it was not looking for; a list can only be missing an entry.
Twenty — A sentence admitting more than one reading is a defect no check on the numbers can see. The description of one competition structure contained two independent ambiguities (who would give up the place, and whether he gave it up by playing or not) and those two ambiguities made four different competitions, with results between 7.3 and 11.2 per cent. All the numerical checks went on passing, because the number published was right: it was the sentence that described a different one.
The remedy is not to re-read carefully, because whoever re-reads already knows what he meant: it is to count the possible readings of every sentence describing a procedure, and rewrite it until only one remains.
Twenty-one — Two independent implementations find what no internal check finds. The ambiguity in the previous entry did not emerge from a check, but from the fact that a second implementation, written reading only the description in prose and without looking at the first, built a different competition and obtained a number three and a half points away.
No verification apparatus built around a single implementation could have noticed, because every check would have confirmed that the code does what the code does.
The same thing happened a second time, and it confirms the rule instead of merely illustrating it: a second implementation rewritten from the current specification showed that the reliability of the distance rule was being taken over all matches instead of over tied matches alone, with an overestimate of nine points. Thirty-one internal checks were green, because the engine was consistent with itself.
Real redundancy is not computing twice: it is two people reading the same description and building.
And, above all of them, the limit none of them sees
They all check the calculations. None checks the meaning attributed to the results.
It is the limitation of the apparatus, and it has to be declared as plainly as its successes, because anyone who sees the apparatus without its limitation infers from it a guarantee that is not there.
This appendix contains the formulas used in the volume, with the minimum of derivation needed to redo the calculations. The formulas are numbered from S1 and are referred to in the text. Anyone who does not read it loses no result: there are none new here, only the reasons for those already given.
The model
S1 — Radial distribution. If the two impact coordinates are independent, of zero mean and equal dispersion σ, then the distance from the centre R has distribution function
F(r) = P(R ≤ r) = 1 − exp(−r² / 2σ²), r ≥ 0
and it is the Rayleigh distribution with parameter σ. The density is f(r) = (r/σ²)·exp(−r²/2σ²). Equivalently, R²/σ² follows a chi-squared with two degrees of freedom.
S2 — Score of one arrow. With rings of width W and a ten-ring face, the score is s(r) = max(0, 11 − ⌈r/W⌉) capped at 10. The probability of the ring of value v is
p_v(σ) = F(a_{v−1}) − F(a_v), with a_v = (10 − v)·W
and the expected score over n arrows is n·Σ_v v·p_v(σ). Numerical inversion of this relationship — given the expected score, find σ — produces the calibration table of chapter 4. For the 122 cm face, W = 6.1 cm and the radius of the X ring is 3.05 cm.
Note on numerical stability. Computing p_v as the difference of two values of F loses every significant digit in the low rings: for a 690-point archer the three outermost rings come out exactly zero, because F saturates at one in finite-precision arithmetic already at r ≈ 36 cm for σ ≈ 3.8 cm. The correct form is on the log scale: log p_v = −a_v²/2σ² + log(1 − exp(−(a_{v−1}² − a_v²)/2σ²)). The probabilities still sum to one even with the unstable form, so the normalisation check does not intercept this defect.
The optimal rule on coordinates
S3 — Likelihood ratio. Let the two dispersions be known as an unordered set {σ_b, σ_p}, with σ_b < σ_p, and let it be required to decide which archer has which. The logarithm of the ratio between the two possible assignments is
log Λ = ½ · (1/σ_p² − 1/σ_b²) · (S_A − S_B), with S_j = Σ_i r_{j,i}²
Since the first factor is negative for every pair, the Bayes rule assigns the smaller dispersion to whoever has the smaller sum of squared radii, and the sign does not depend on the values of the two dispersions: the rule is uniformly optimal. It follows that it is optimal for any symmetric prior distribution over the two assignments, under zero-one loss, and it is minimax within the same class: with an asymmetric loss or with unbalanced priors the likelihood-ratio threshold shifts and the optimality has to be re-examined.
S4 — Invariance under conditioning. The event “five-all” is invariant under exchange of the two archers’ labels, so P(5-5 | H₁) = P(5-5 | H₂) and the two normalising constants cancel in the ratio. The rule of S3 remains the Bayes rule even conditionally on the tie.
S5 — Unconditional closed form. Since S_j/σ_j² ~ χ²_{2n}, the comparison between the two sums is a ratio of scaled chi-squareds, hence
C_unc(n, ρ) = P(F_{2n,2n} < ρ²), with ρ = σ_p/σ_b
It is the table of chapter 6. For n = 1 the distribution function of F(2,2) is x/(1+x), which gives the case of the single-arrow shoot-off (S8).
The ring weights
S6 — Optimal rule on the rings alone. If only the per-ring counts are observed, the Bayes rule is a weighted count with weights
w_v = log[ p_v(σ_b) / p_v(σ_p) ]
and the decision compares Σ_v n_v w_v between the two archers. The weights depend on the values of the two dispersions, not only on their order. If the dispersions are not known they are estimated, and the way they are estimated decides everything: the common level σ̂ is obtained from the total of the thirty arrows on the two scorecards taken together, by inverting the expected score, and the weights are computed on the pair {σ̂(1−δ), σ̂(1+δ)} with δ a declared nominal separation. It is the shape of the weights that depends on the level, not on the gap, and it is the reason the estimated version decides as the known-dispersion one does except about once in a million — 52 times out of 50,468,034 tied matches. Estimating each archer’s dispersion from his own scorecard alone, by contrast, the property collapses: when the two totals coincide the weights vanish and the rule stops deciding, with disagreement rising to ten per cent.
S7 — Concavity of the weights. Setting t = 1/2σ², u_k = (kW)², d_k = u_k − u_{k−1} = W²(2k−1) and h(y) = log(1 − e^{−y}), the second difference of the weights with respect to the ring index decomposes as
Δ²w = −2W²(t_b − t_p) + [G_k(t_b) − G_k(t_p)], with G_k(t) = h(d_{k−1}t) − 2h(d_k t) + h(d_{k+1}t)
The first term is strictly negative. Rescaling in v = W²t the factor W² cancels and the concavity condition becomes a pure number per ring: sup_v Q_k(v) < 2, with Q_k(v) = [ψ((2k−3)v) − 2ψ((2k−1)v) + ψ((2k+1)v)]/v and ψ(y) = y/(e^y − 1). By Taylor with remainder, Q_k(v) = 4v·ψ′′(ξ) with ξ ≥ (2k−3)v, whence Q_k ≤ 4C/(2k−3) with
C = sup_{y>0} y·ψ′′(y) = 0.23154848, attained at y = 2.3469
What is required is C < 1/2: the margin is 2.159. The constant does not depend on σ, on the pair, on the ring width or on the format: the concavity is global. The boundary case of the outermost ring is settled separately by observing that ψ′′ > 0 implies |ψ′| ≤ 1/2.
Note on stability. The closed form ψ′′(y) = ey[(y−2)e^y + y + 2]/(ey − 1)³ is numerically unreliable below y ≈ 10⁻⁴ (cancellation in the numerator) and above y ≈ 700 (overflow). The positivity check should be carried out on ψ(y) = y/expm1(y) with finite differences, or on an equivalent rescaled form.
The set-play tie
S8 — Single-arrow shoot-off. For two independent Rayleigh variables with parameters a and b,
P(R_A < R_B) = b² / (a² + b²)
which with b = ρa gives ρ²/(1+ρ²). For mixtures of Rayleighs the form extends to Σ_p Σ_q w_p w_q · b_q²/(a_p² + b_q²). It coincides with the form of S5 at n = 1.
S9 — Probability of ending five-all. Writing p_w, p_t, p_l for the probabilities that a set is won, drawn or lost by archer A, a five-all tie requires a wins, t draws and b losses with 2a + t = 5 and a + t + b = 5, whence b = a and a ∈ {0,1,2}. The three terms have multinomial multiplicities 1, 20, 30, for a total of 51 paths. Moreover, with a ≤ 2 the highest score reachable before the last set is 5: the stopping threshold at six is never binding on the five-all slice, so the free walk and the absorbing chain coincide there. It follows that
P(5-5) = p_t⁵ + 20·p_w p_t³ p_l + 30·p_w² p_t p_l²
S10 — Gain from a tie-break rule. Defining C(rule, Δ) as the probability that the rule identifies the better archer conditionally on the tie, the gain relative to a draw is
G(Δ) = P(5-5 | Δ) · [C(rule, Δ) − ½]
and it is the quantity reported in percentage points on the probability of winning the match. G vanishes at Δ = 0 (where C = ½ by symmetry) and as Δ → ∞ (where P(5-5) → 0), and therefore has an interior maximum.
The reversal of the ten count
S11 — The statement. Let T = Σ_i s_i be the total of the fifteen arrows and D = #{i : s_i = 10} the ten count. Conditionally on T being equal for the two archers, D behaves as a measure of dispersion and not of location: at a fixed total both archers have lost the same deficit relative to the maximum, and the one with more tens concentrates it on fewer arrows. Setting K = 150 − T for the deficit from the maximum, it is distributed over the 15 − D arrows that are not tens, and the mean deficit on those is K / (15 − D): it grows with D. The constraint is on the weight each non-maximal arrow has to carry, not on the number of low arrows nor on the variance, which at a fixed total can move either way. Over this population the correspondence with low arrows is tight, but it is not a constraint: at a total of 140 one can have ten tens with a single arrow below nine, and nine tens with two — how tight it is, the correlation below says.
Formally, for a count vector (n_0, …, n_10) with Σ n_v = 15 and Σ v·n_v = T fixed, the pair (n_10, Σ_{v≤8} n_v) is not constrained: increasing n_10 by one requires subtracting points elsewhere, and the way that minimises the number of arrows involved is to lower one by many rings — but it is not the only way, and configurations running counter to the pattern can be constructed on paper, as the counterexample at a total of 140 shows. What follows is therefore not a combinatorial necessity: it is a property of the model, and the correlation below measures its strength.
The constraint is measured by the Pearson correlation between the difference in tens and the difference in arrows of eight or less, computed over the population of matches with the two totals equal and pooled across all totals, without centring within each. It is 0.9898 on the reference cell and decreases with level: 0.9978 on the 700-690 pair, 0.9488 on the 680-660 pair. At low levels there are more ways of composing the same total, so the arithmetic constraint loosens and the correspondence between tens and low arrows stops being almost deterministic.
S12 — Consequence. Under the standard model, greater dispersion corresponds to lesser ability. At an equal total the ten count therefore identifies the weaker archer more often than the better one, and the measurement is worth more than the deduction: individual scorecards running counter to it can be constructed with fifteen arrows and a total of a hundred and forty. The exact measurements give between 36.6 and 48.7 in a hundred across the whole grid examined: below fifty everywhere.
S13 — Domain. The reversal disappears when the tail of the distribution is marked and concentrated, because the tail adds ways of composing the same total and loosens the constraint. It does not withdraw under off-centring, anisotropy or drift. The discriminant is not the mass in the low rings but its concentration, and two configurations of the grid show it: the tail at 3% over three rings brings a mass below nine of 0.332 and the off-centre tail 0.385 — almost the same — but the correlations between tens and low arrows are 0.831 and 0.991, and the behaviours separate. The first withdraws the inversion, taking the ten count to 52.6, that is, above the coin; the second deepens it to 41.8. Same low mass, opposite outcome: what decides is how that mass is distributed. The pair constructed purposely to isolate the mechanism shows it at exactly equal mass: two mixtures in which a fraction ε of the arrows comes from a group c times wider, with ε = 0.40 and c = 1.2 in the first — many arrows displaced a little — and ε = 0.010 and c = 6.0 in the second, few arrows displaced a lot. The masses below nine are 0.2112 and 0.2114, indistinguishable; the arithmetic constraint is 0.991 and 0.715; and the ten count is 45.78 in the first and 49.07 in the second.
S14 — The X ring. The X ring is a subdivision inside the ten ring: moving from a ten to an X does not alter the total, so the X count is not constrained by the sum in the same way. It therefore remains informative conditionally on level totals, as long as the radius of the X is large relative to the dispersion. The crossing depends on the gap between the two archers and is not a single value: it is r_X/σ = 0.508 with 5 points of gap, 0.522 with 10 and 0.547 with 20 — corresponding to levels of 667, 669 and 673 points out of 720.
The ranking
S15 — Season-scale ceiling. It is S5 evaluated at large n. For small gaps, ρ ≈ 1 + δ with δ small, and the probability grows like the distribution function of a normal in √n·δ. Hence the scaling: the number of arrows required for a given reliability grows as 1/δ².
S16 — Cost of the scorecard. The ratio between the arrows required reading rings and reading coordinates turns out constant at 1.43–1.44 across all the gaps examined. In percentage points the same quantity has an interior maximum, because reliability is bounded between ½ and 1 while the arrow count is not.
S17 — Event effect. Modelled as a number of points common to all participants at a competition, with standard deviation σ_E, on the same scale on which the estimator looks for it. The effect measures how favourable the conditions were: a positive e_j is an easy competition and raises everyone’s score, as in the model. Applying one of e points to an archer of level L means having him shoot with the spread corresponding to L + e, so that it is worth e expected points for anybody not close to the maximum of the round: the map from spread to expected score is not linear, and a common factor on the dispersion would be worth different points for archers of different levels. The reference scale is the 72-arrow round: on the 36- and 144-arrow rounds of Part Three the effect is rescaled in proportion to the length, and then produces the same shooting spread across all three — it is why the numbers for those formats are comparable with each other. For two archers sharing the competition the shift is the same and cancels in the comparison; for archers at different competitions they are independent draws and add to the noise. Whence the measured behaviour: full overlap cancels the effect almost entirely, zero overlap leaves it whole.
S18 — Connectedness of the design. With fixed event effects, the comparison between two athletes sharing no competition, neither directly nor through a chain of intermediate athletes, is not estimable: the efficiency of the design is zero. With random effects the comparison is possible but degraded continuously. The choice between the two models is not technical but substantive. Here the estimation is fixed-effects, by least squares, with the difficulties constrained to sum to zero and connectedness required: if the graph splits, the function does not answer. A random-effects model would answer even then, but that number would come from the assumed distribution over the events more than from the competitions observed.
S19 — Noisy seeding and propagation. The bracket is built on the order observed after the qualification round, not on the true one. Writing Π for the observed order and Π* for the true one, every structure is a function that consults Π a number k of times: k = 1 for the fixed bracket, which consults it once only to compose the initial bracket, and k = 6 for reseeding, which re-consults it before each of the six rounds. The loss relative to the case Π = Π* grows with k, and it is measured at +1.24 ± 0.47 for k = 1 and +5.83 ± 0.53 for k = 6 on a compact field.
S20 — Estimation of the season ranking. The score of archer i at competition j is y_ij = μ + a_i + e_j + ε_ij, with a the archer’s level and e the difficulty of the competition in points. The two sets of effects are estimated together by least squares over only the archer–competition pairs actually shot, with the constraint Σ_j e_j = 0 making the solution unique: adding a constant to all the a’s and subtracting it from all the e’s would indeed leave the predictions identical. On top of the estimate, shrinkage towards the mean is applied, with weight n_i τ² / (n_i τ² + σ²), where σ² is the variance of the residuals and τ² is obtained by removing the error component from the variance of the raw estimates. It is an approximation, and that should be said: the exact weight depends on the variance of the individual athlete’s estimate, which in an unbalanced design is not a function of the number of appearances alone but of the whole design matrix — whom the competitions were shared with also counts. I use n_i because it is the form that can be redone by hand; an exact shrinkage would require the diagonal of the covariance matrix of the coefficients. Estimating in two stages — centring each athlete on his own mean and then averaging the residuals by competition — is not equivalent when appearances are unbalanced: it subtracts from each athlete the mean of the effects of his own calendar, and with different calendars that constant is not common. It is not an error that attenuates with more data: there exists a case with five archers, five competitions, no noise and a connected participation graph in which the sequential procedure puts a 698 archer ahead of a 700 archer, while the joint estimation recovers the exact order. The constraint identifies the differences between levels only within a connected component of the archer–competition graph: between disjoint components the origin is not in the data, and shrinkage towards the general mean is an assumption that aligns them, not a measurement.
S20b — The shrinkage weight. Writing μ for the mean of the group’s raw estimates, m_i for athlete i’s raw estimate and n_i for the number of competitions he entered, the shrunken estimate is
m̂_i = μ + w_i · (m_i − μ), with w_i = n_i·τ² / (n_i·τ² + σ²)
where τ² is the variance among the athletes’ true levels and σ² the variance of a competition score about its own level. Both are estimated from the data: σ² from the dispersion of the residuals after correction for difficulty, τ² from the variance of the raw estimates minus σ² divided by the mean number of competitions. The weight grows with the number of competitions and tends to one when data are abundant; with τ much larger than σ the shrinkage is slight even for little data, and that is the case of the example in chapter 47, where every athlete shot three competitions or more and the weights are all above 0.97. Shrinkage bites when an athlete has only one or two competitions, and that is where it is needed.
S21 — Pairing of the contenders. The precision of the comparison between the two candidates for first place depends on the fraction of competitions they share: if they shoot the same competitions, the common difficulty cancels in their difference — exactly so long as neither is so close to the maximum of the round that he cannot rise by the whole effect, because the generator truncates there and the realised shift is no longer the same for both. It has to be kept distinct from the global connectedness of the design, which is a question of identifiability and not of precision: without connectedness the origins of two components are not in the data, and with the two-way estimation a calendar of disjoint blocks is no better than a draw. Pairing the top eight recovers most of the gap between a structured calendar and a drawn one, and at the precision of the current simulation extending the pairing beyond the eight shows no additional benefit that can be resolved: the recovery is +0.8 with eight paired, +0.7 with sixteen and +0.8 with all thirty-two, measured as a paired contrast over twelve thousand seasons in which only the calendar changes, with an error of half a point on each. It stays the same if the eight are chosen from the previous season’s ranking instead of from the true order: the contrast is +0.9 instead of +0.8, within the same error. In the simulated grid, extending the pairing beyond the top eight produces no additional benefit clearly resolvable at the current precision. Eight is therefore a reasonable operating point, not a demonstrated saturation threshold. The design criterion for a calendar remains the same: not that everybody should meet, but that the contenders should meet.
Conventions
Rounding of arrow counts. All the inversion tables — “how many arrows for a given reliability” — report the smallest integer n such that the reliability is greater than or equal to the target. Anyone recomputing by truncating the continuous inversion would obtain values one lower, at which the reliability is still below the target.
Ties. Where a rule can tie, ties are credited at one half — which is equivalent on average to settling them with a fair draw. The tie frequency is in any case reported separately for each rule, because a rule worth 58 in a hundred while tying four times in ten is not the same thing as one worth 58 that never ties.
Anchoring. Every gap expressed in points is anchored to a declared level, because the translation between points and dispersion is not linear: one point is worth 1.81 per cent of dispersion at 700 and 1.32 per cent at 680. The reference cell of Part One is 690 against 680.
Population. Every number declares whether it is conditional on the set-play tie or not. The two populations give very different answers — it is the content of chapter 7 — and confusing them is the easiest error in the volume.
How to cite
This volume is independent research, published in full on this page and as a PDF.
Campagna, M. (2026). When Nobody Won: ties, competitions and seasons in archery. Version 1.0, 11 September 2026. Independent research. https://matteocampagna.com/en/laboratorio/when-nobody-won
@techreport{campagna2026whennobodywon,
  author  = {Campagna, Matteo},
  title   = {When Nobody Won: ties, competitions and seasons in archery},
  version = {1.0},
  year    = {2026},
  month   = {9},
  type    = {Independent research},
  url     = {https://matteocampagna.com/en/laboratorio/when-nobody-won}
}
The other two essays in the group run the same calculation engine on narrower questions, and each comes with its own reproduction package: the set system and the shoot-off.